
KeyVex › 2026 Midterms › Virginia

Follow the money into the midterms

26days to Election DayTuesday, Nov 3
Updated Oct 8, 10:20 PM ET
Data as of

Every federal race on the ballot, the money behind it, and what the incumbents do with their own money: campaign cash, outside spending, stock trades, estimated net worth and the federal dollars flowing into each state. Public records, refreshed twice a day.

  • Campaign totals mostly through Jun 30, 2026
  • Outside spending through Oct 8, 2026
  • Trades disclosed through Oct 7, 2026
Skip the map

Who holds the seats up in 2026

View as table
Senate raceSpecial election

Who holds the seat today. Not a forecast.

Source: Senate and House rosters, as of Sep 27, 2026

KeyVex does not rate races, publish odds or call results. Colors show money, trades or who holds a seat today, never who will win.

House reports filed as scanned images since Jun 4, 2026 are not yet included, so some House members' trade counts are low.

State report

Virginia

On the ballot Nov 3U.S. SenateU.S. House (11 seats)
Campaign totals mostly through Jul 15, 2026, each campaign through its latest report; outside spending through Oct 8, 2026; trades disclosed through Oct 7, 2026.

At a glance

Outside money
$13.9M$2.9M for, $11.0M againstincludes $12.6M from 24/48-hour notices
#25 of 51Median state $13.1M
Campaign money (leading campaigns)
$64.8M2025-26 receipts of the leading campaigns in this state's 2026 racesAll filers: $77.8M
#10 of 51Median state $26.5M
Delegation trading (12 mo)
$1.7M est.44 trades by this state's members in the last 12 monthsOne member accounts for 61% of this
#25 of 51Median state $1.5M est.
Federal awards
$149.10BFY2025 contracts, grants and other assistance; per resident n/a (no population figure). Direct payments are shown apart, below

House reports filed as scanned images since Jun 4, 2026 are not yet included, so some House members' trade counts are low.

FEMA major disasters since 2021: 6Unemployment 3.6% (Aug 2026); US 4.1% (Aug 2026)

Source: FEC Schedule E through Oct 8, 2026 and FEC campaign reports (2025-26 receipts), mostly through Jul 15, 2026; Senate and House periodic transaction reports disclosed through Oct 7, 2026; USAspending.gov (FY2025) and Census Bureau population estimates (Vintage 2025), as of Oct 8, 2026. How we count

Senate (Class II)

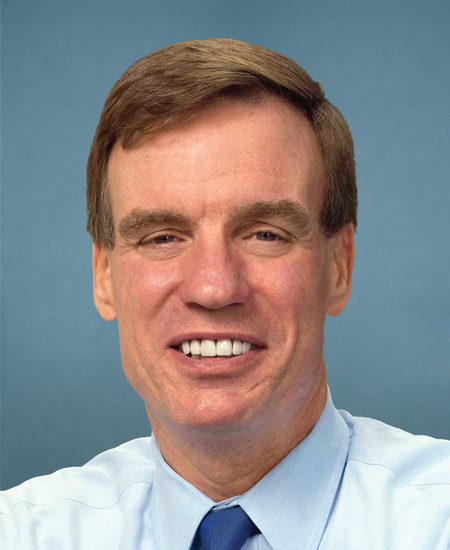
Mark R. Warner
Nominee source
5 trades in the last 12 months, $341K est.
Net worth $224.8M (est.), from the 2025 annual report · filing
Ranking Member, Securities, Insurance, and Investment · Vice Chairman, Senate Select Committee on Intelligence

On the November ballot

Mark R. Warner D Incumbent Nominee source
Raised $17.9MSpent $7.3MCash $16.1Mthrough Jul 15, 2026
includes $5.8M transferred from the candidate's other committees · from PACs 12%
Against $0Outside moneyFor $161K
includes $11K from 24/48-hour notices
Top spenders

For

  1. Fellowship PACSuper PAC · 1 purchase · latest Jul 27, 2026$150K filing
  2. Thomas Paine Society L.L.C.Organization (not a registered committee) · 2 purchases · latest Oct 4, 2026$11K filing
  3. Givegreen United ActionSuper PAC · 1 purchase · latest Dec 17, 2025<$1K filing
Bert Mizusawa R Nominee source
Raised $419KSpent $329KCash $90Kthrough Jul 15, 2026
self-funded 41% · from PACs 1% · debts $51K
Also filed with the FEC (11), $462K raised

Source: FEC campaign reports, 2025-26 receipts (through Jul 15, 2026); FEC Schedule E through Oct 8, 2026; Senate disclosures for the incumbent's trades and net worth, as of Oct 8, 2026. How we count

House races

11 races, 0 open. Races follow the district each candidate filed for with the FEC.

Each race shows the candidates on its official November list. Open a row for its campaigns: raised spent cash on hand, on one scale per race, through Jul 15, 2026 unless another date is shown.

Districts: outside money
None reportedUnder $250K$250K to $1M$1M to $5M$5M to $15M$15M or moreBorder: incumbent's party; dashed: openIncumbent traded (12 mo)
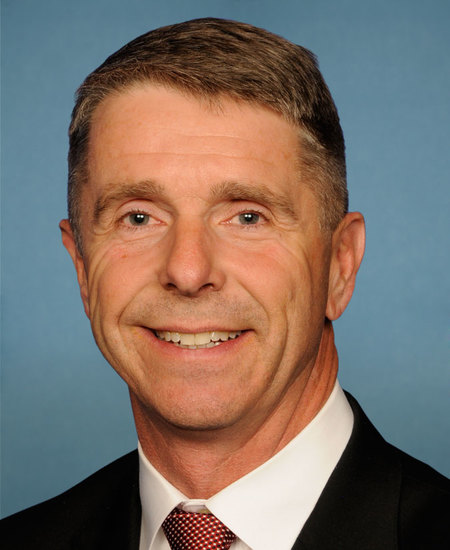
District 1Robert J. WittmanRobert J. Wittman RNomineeRobert J. Wittman R $4.1M / $4.3MShannon Leigh Taylor D $2.1M / $1.0M$5.6M1$8K est.0

Robert J. Wittman: Nominee source. 1 trade in the last 12 months, $8K est. Trades and net worth

  • Robert J. Wittman R Incumbent$4.1M raised · $1.1M spent · $4.3M cashincludes $1.3M transferred from the candidate's other committees · from PACs 29%
    Outside money: against $4.7M, for $181K, includes $4.1M from 24/48-hour notices. Top for: No Going Back PAC Inc. $149K, Civic Renewal Fund Inc. $31K. Top against: Your Community PAC $1.8M, HMP $1.7M.
  • Shannon Leigh Taylor D$2.1M raised · $1.1M spent · $1.0M cashfrom PACs 16%
    Outside money: against $155K, for $480K, includes $584K from 24/48-hour notices. Top for: SD 2026 $267K, Progressive Turnout Project $133K. Top against: No Going Back PAC Inc. $150K, Civic Renewal Fund Inc. $4K.
Also filed with the FEC (12), $1.9M raised
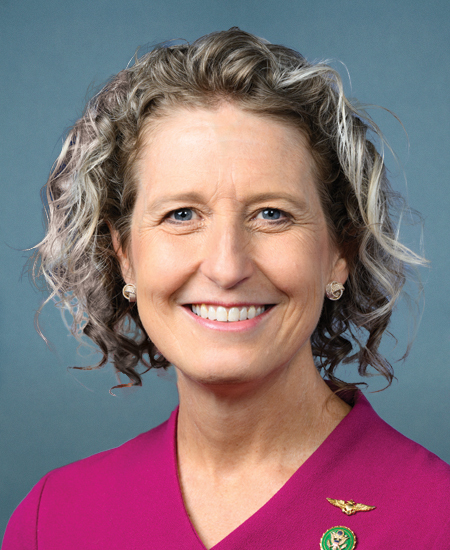
District 2Jennifer A. KiggansJennifer A. Kiggans RNomineeJennifer A. Kiggans R $6.0M / $3.4MElaine Luria D $4.7M / $3.6MGeral Defrance Staten I n/a / n/aMatthew Baker I n/a / n/a$5.7M00

Jennifer A. Kiggans: Nominee source. No trades in the last 12 months. Trades and net worth

  • Jennifer A. Kiggans R Incumbent$6.0M raised · $2.6M spent · $3.4M cashincludes $1.7M transferred from the candidate's other committees · from PACs 21% · debts $38K
    Outside money: against $3.6M, for $883K, includes $4.4M from 24/48-hour notices. Top for: American Association of Nurse Anesthetists Separate Segregated Fund (Crna-Pac) $260K, No Going Back PAC Inc. $194K. Top against: HMP $1.4M, Giffords PAC $922K.
  • Elaine Luria D$4.7M raised · $1.1M spent · $3.6M cashincludes $867K transferred from the candidate's other committees · from PACs 9%
    Outside money: against $1.0M, for $211K, includes $1.2M from 24/48-hour notices. Top for: Progressive Turnout Project $210K, Dmfi PAC <$1K. Top against: No Going Back PAC Inc. $762K, America PAC $219K.
  • Geral Defrance Staten IRegistered; no financial report on file yet
  • Matthew Baker I Registered; no financial report on file yet
Also filed with the FEC (10), $1.6M raised
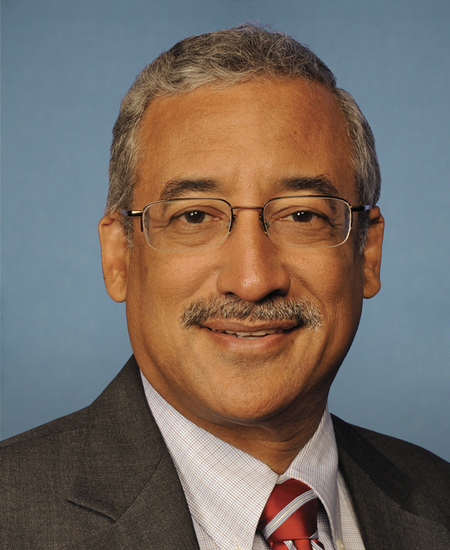
District 3Robert C. "Bobby" ScottRobert C. "Bobby" Scott DNomineeRobert C. "Bobby" Scott D $688K / $192KStephen C. Woll I $34K / $15KEdwin Rivera Jr. R $7K / $2KMakiba Gaines I n/a / n/aNone00

Robert C. "Bobby" Scott: Nominee source. No trades in the last 12 months. Trades and net worth

  • Robert C. "Bobby" Scott D Incumbent$688K raised · $659K spent · $192K cashfrom PACs 44% · debts $3K
  • Stephen C. Woll I$34K raised · $20K spent · $15K cashself-funded 58% · debts $20K
  • Edwin Rivera Jr. R$7K raised · $5K spent · $2K cashself-funded 63% · from PACs 8%
  • Makiba Gaines I Registered; no financial report on file yet
Also filed with the FEC (3), $24K raised
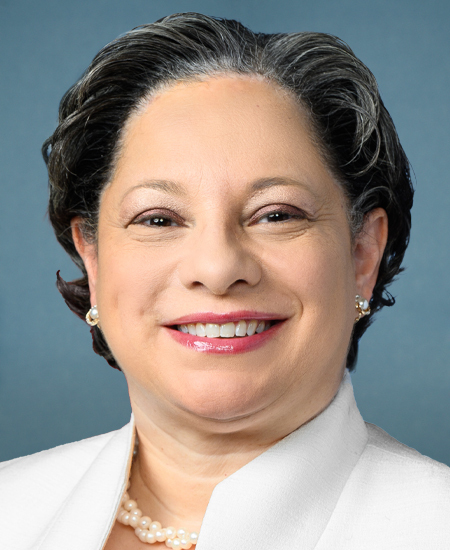
District 4Jennifer L. McClellanJennifer L. McClellan DNomineeJennifer L. McClellan D $1.1M / $197KJoan E. Bell I n/a / n/aRobert P. Murray R n/a / n/aNone1$175K est.0

Jennifer L. McClellan: Nominee source. 1 trade in the last 12 months, $175K est. Trades and net worth

  • Jennifer L. McClellan D Incumbent$1.1M raised · $992K spent · $197K cashfrom PACs 54%
  • Joan E. Bell IRegistered; no financial report on file yet
  • Robert P. Murray RRegistered; no financial report on file yet
Also filed with the FEC (3), $2K raised
District 5John J. McGuire IIIJohn J. McGuire III RNomineeThomas Perriello D $2.1M / $1.5MJohn J. McGuire III R $1.8M / $524KCooke Costa Harvey I n/a / n/a$2.2M17$136K est.0

John J. McGuire III: Nominee source. 17 trades in the last 12 months, $136K est. Trades and net worth

  • Thomas Perriello D$2.1M raised · $629K spent · $1.5M cashfrom PACs 5%
    Outside money: against $244K, for $252K, includes $496K from 24/48-hour notices. Top for: Black Voters Matter Action PAC $213K, RP PAC $25K. Top against: No Going Back PAC Inc. $240K, Civic Renewal Fund Inc. $4K.
  • John J. McGuire III R Incumbent$1.8M raised · $1.3M spent · $524K cashincludes $246K transferred from the candidate's other committees · from PACs 23% · debts $41K
    Outside money: against $1.2M, for $493K, includes $1.7M from 24/48-hour notices. Top for: Virginians for Conservative Leadership PAC $261K, No Going Back PAC Inc. $211K. Top against: Our Virginia $1.2M, RP PAC $51K.
  • Cooke Costa Harvey IRegistered; no financial report on file yet
Also filed with the FEC (10), $805K raised
District 6Ben ClineBen Cline RNomineeBeth Macy D $1.7M / $847KBen Cline R $1.4M / $711K$7K00

Ben Cline: Nominee source. No trades in the last 12 months. Trades and net worth

  • Beth Macy D$1.7M raised · $839K spent · $847K cashfrom PACs 2%
  • Ben Cline R Incumbent$1.4M raised · $1.1M spent · $711K cashfrom PACs 41%
    Outside money: against $0, for $7K. Top for: Freedom Caucus Fund $7K.
Also filed with the FEC (4), $363K raised
District 7Eugene Simon VindmanEugene Simon Vindman DNomineeEugene Simon Vindman D $12.4M / $6.6MDouglas Ollivant R $251K / $66KAlaha Ahrar I <$1K / <$1KJoshua Ertle I n/a / n/a$216K00

Eugene Simon Vindman: Nominee source. No trades in the last 12 months. Trades and net worth

  • Eugene Simon Vindman D Incumbent$12.4M raised · $5.9M spent · $6.6M cashfrom PACs 7%
    Outside money: against $46K, for $170K, includes $126K from 24/48-hour notices. Top for: Votevets $170K, Givegreen United Action <$1K. Top against: The Conservative Caucus $46K.
  • Douglas Ollivant R$251K raised · $185K spent · $66K cashfrom PACs 3%
  • Alaha Ahrar I<$1K raised · $0 spent · <$1K cashthrough Jun 30, 2026
  • Joshua Ertle I Registered; no financial report on file yet
  • Randall Terry I Registered; no financial report on file yet
  • Taner E. Demirci Lopez Libertarian No FEC filing on file
Also filed with the FEC (18), $4.0M raised
District 8Donald S. Beyer, Jr.Donald S. Beyer, Jr. DNomineeDonald S. Beyer, Jr. D $2.1M / $839KTim Sharman I $25K / $4KTony Sabio R $22K / $18KShelly M. Arnoldi Libertarian n/a / n/aNone20$1.0M est.0

Donald S. Beyer, Jr.: Nominee source. 20 trades in the last 12 months, $1.0M est. Trades and net worth

  • Donald S. Beyer, Jr. D Incumbent$2.1M raised · $1.8M spent · $839K cashfrom PACs 27%
  • Tim Sharman I$25K raised · $21K spent · $4K cashthrough Jun 30, 2026 · self-funded 100% · debts $25K
  • Tony Sabio R$22K raised · $4K spent · $18K cashfrom PACs 5%
  • Shelly M. Arnoldi Libertarian No FEC filing on file
Also filed with the FEC (8), $480K raised
District 9H. Morgan GriffithH. Morgan Griffith RNomineeH. Morgan Griffith R $1.8M / $974KJoy Powers D $85K / $14K<$1K00

H. Morgan Griffith: Nominee source. No trades in the last 12 months. Trades and net worth

  • H. Morgan Griffith R Incumbent$1.8M raised · $1.3M spent · $974K cashfrom PACs 67%
    Outside money: against $0, for <$1K. Top for: Freedom Caucus Fund <$1K.
  • Joy Powers D$85K raised · $71K spent · $14K cash
Also filed with the FEC (6), $69K raised
District 10Suhas SubramanyamSuhas Subramanyam DNomineeSuhas Subramanyam D $1.2M / $583KDavid Beckwith R $107K / $54KAhsen Mujeeb Malik I n/a / n/a<$1K00

Suhas Subramanyam: Nominee source. No trades in the last 12 months. Trades and net worth

  • Suhas Subramanyam D Incumbent$1.2M raised · $678K spent · $583K cashfrom PACs 27%
    Outside money: against $0, for <$1K. Top for: Givegreen United Action <$1K.
  • David Beckwith R$107K raised · $53K spent · $54K cashself-funded 47% · from PACs 2% · debts $50K
  • Ahsen Mujeeb Malik IRegistered; no financial report on file yet
Also filed with the FEC (5), $274K raised
District 11James R. WalkinshawJames R. Walkinshaw DNomineeJames R. Walkinshaw D $2.8M / $979KArthur Grahame Purves R $11K / <$1KDianne L Blais Green n/a / n/a$51K00

James R. Walkinshaw: Nominee source. No trades in the last 12 months. Trades and net worth

  • James R. Walkinshaw D Incumbent$2.8M raised · $1.8M spent · $979K cashfrom PACs 33%
    Outside money: against $0, for $51K. Top for: Oversight Action Fund $51K.
  • Arthur Grahame Purves R$11K raised · $11K spent · <$1K cashthrough Aug 27, 2026 · self-funded 37% · debts $4K
  • Dianne L Blais GreenRegistered; no financial report on file yet
Also filed with the FEC (8), $3.1M raised

Source: FEC campaign reports, 2025-26 receipts (mostly through Jul 15, 2026, each campaign through its latest report); FEC Schedule E through Oct 8, 2026; House disclosures for incumbents' trades, as of Oct 8, 2026. How we count

The delegation's own money

House reports filed as scanned images since Jun 4, 2026 are not yet included, so some House members' trade counts are low.

Every current member from Virginia, including senators not up this year. Trades dated Oct 8, 2025 to Oct 8, 2026; every volume is an estimate from the ranges filed.

Estimated volume by member (12 mo)

Donald S. Beyer, Jr. D$1.0M est.Mark R. Warner D$341K est.Jennifer L. McClellan D$175K est.John J. McGuire III R$136K est.Robert J. Wittman R$8K est.

No trades in the last 12 months: Ben Cline, Eugene Simon Vindman, H. Morgan Griffith, James R. Walkinshaw, Jennifer A. Kiggans, Robert C. "Bobby" Scott, Suhas Subramanyam, Tim Kaine


Purchases: 25Sales: 16Exchanges: 344trades
  • Purchases25
  • Sales16
  • Exchanges3
$1.7M est. across 44 trades

Most traded by this delegation

Donald S. Beyer, Jr.
Donald S. Beyer, Jr. DVirginia · District 82026: Nominee source
20trades (12 mo)$1.0M est.volume0late (over 45 days)Sep 23, 2026last traded
13 purchases 4 sales 3 exchanges
Net worth $88.9M (est.), from the 2025 annual report · filing
Mark R. Warner
Mark R. Warner DVirginia2026: Nominee source
5trades (12 mo)$341K est.volume0late (over 45 days)Jul 7, 2026last traded
3 purchases 2 sales
Net worth $224.8M (est.), from the 2025 annual report · filing
Ranking Member, Securities, Insurance, and Investment · Vice Chairman, Senate Select Committee on Intelligence
Jennifer L. McClellan
Jennifer L. McClellan DVirginia · District 42026: Nominee source
1trade (12 mo)$175K est.volume0late (over 45 days)Apr 7, 2026last traded
0 purchases 1 sale
Net worth $2.3M (est.), from the 2025 annual report · filing
John J. McGuire III
John J. McGuire III RVirginia · District 52026: Nominee source
17trades (12 mo)$136K est.volume0late (over 45 days)Aug 18, 2026last traded
9 purchases 8 sales
Net worth $802K (est.), from the 2025 annual report · filing
Robert J. Wittman
Robert J. Wittman RVirginia · District 12026: Nominee source
1trade (12 mo)$8K est.volume0late (over 45 days)Jun 30, 2026last traded
0 purchases 1 sale
Net worth $4.1M (est.), from the 2025 annual report · filing
Chairman, Tactical Air and Land Forces · Vice Chair, House Committee on Natural Resources
Ben Cline
Ben Cline RVirginia · District 62026: Nominee source

No trades in the last 12 months

Net worth $993K (est.), from the 2025 annual report · filing
Eugene Simon Vindman
Eugene Simon Vindman DVirginia · District 72026: Nominee source

No trades in the last 12 months

Net worth (est.): no figure, debts match or exceed assets, at midpoints. Latest: the 2025 annual report · filing
H. Morgan Griffith
H. Morgan Griffith RVirginia · District 92026: Nominee source

No trades in the last 12 months

Net worth (est.): no figure, debts match or exceed assets, at midpoints. Latest: the 2025 annual report · filing
Chair, Health
James R. Walkinshaw
James R. Walkinshaw DVirginia · District 112026: Nominee source

No trades in the last 12 months

Net worth $883K (est.), from the 2025 annual report · filing
Jennifer A. Kiggans
Jennifer A. Kiggans RVirginia · District 22026: Nominee source

No trades in the last 12 months

Net worth $780K (est.), from the 2025 annual report · filing
Chairwoman, Oversight and Investigations
Robert C. "Bobby" Scott
Robert C. "Bobby" Scott DVirginia · District 32026: Nominee source

No trades in the last 12 months

Net worth $795K (est.), from the 2025 annual report · filing
Ranking Member, House Committee on Education and Workforce
Suhas Subramanyam
Suhas Subramanyam DVirginia · District 102026: Nominee source

No trades in the last 12 months

Net worth $2.2M (est.), from the 2025 annual report · filing
Ranking Member, Military and Foreign Affairs
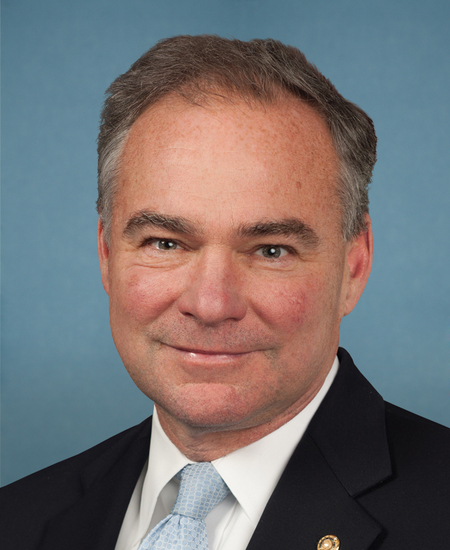
Tim Kaine
Tim Kaine DVirginiaSeat not up in 2026

No trades in the last 12 months

Net worth $1.2M (est.), from the 2025 annual report · filing
Ranking Member, Seapower · Ranking Member, Western Hemisphere, Transnational Crime, Civilian Security, Democracy, Human Rights, and Global Women's Issues
  • Names with apostrophes are not yet matched, so some members may be under-counted.

Source: Senate eFD and House Clerk periodic transaction reports, trades dated Oct 8, 2025 to Oct 8, 2026, disclosed through Oct 7, 2026; annual financial disclosures for net worth, as of Oct 8, 2026. How we count

Federal money, disasters, jobs

Federal money, fiscal year 2025

Award obligations by place of performance; per resident uses Census Bureau July 2025 population estimates; direct payments apart
$149.10B in contracts, grants and other assistance
Contracts $120.57BGrants $28.24BOther assistance $286.6M

Direct payments: $65.04B. Not in the comparison above: USAspending can record some of them, including Medicare payments, where the contractor or insurer that pays them is located rather than where the people paid live.

Loans (face value): $8.71B

FEMA major disasters since 2021

One dot per disaster, by declaration date
20222023202420252026
Hurricane or tropical storm 1Flood 1Severe Storm 4

Unemployment rate

Seasonally adjusted; the dashed line is the US
3.6% in Aug 2026 (preliminary); up 0.3 points from a year earlier. US 4.1% in Aug 2026. The national rate for Sep 2026 is 4.2%.
2.5%3.0%3.5%4.0%4.5%5.0%
Jan 2025Jul 2025Jan 2026Jul 2026
VirginiaUS

Source: USAspending.gov, FY2025 (fetched Oct 7, 2026); Census Bureau Vintage 2025 estimates; OpenFEMA, through Oct 2, 2026; BLS Local Area Unemployment Statistics, through Aug 2026; US rate from the Current Population Survey, through Sep 2026, as of Oct 8, 2026. How we count

  • This product uses Census Bureau data but is not endorsed or certified by the Census Bureau.
  • This product uses the FRED® API but is not endorsed or certified by the Federal Reserve Bank of St. Louis. FRED® API Terms of Use
  • BLS.gov cannot vouch for the data or analyses derived from these data after the data have been retrieved from BLS.gov.
  • This product uses the Federal Emergency Management Agency's OpenFEMA API, but is not endorsed by FEMA. The Federal Government or FEMA cannot vouch for the data or analyses derived from these data after the data have been retrieved from the Agency's website(s).
  • Federal spending: USAspending.gov, U.S. Department of the Treasury.

Notes on Virginia

KeyVex does not rate races, publish odds or call results. Colors show money, trades or who holds a seat today, never who will win.

FEC bulk files fetched Oct 8, 2026; campaign totals mostly through Jun 30, 2026; outside spending since Jan 1, 2025, through Oct 8, 2026.

Trades dated Oct 8, 2025 to Oct 8, 2026, disclosed through Oct 7, 2026.

Ballot facts from the official candidate lists, the oldest read Oct 7, 2026; roster as of Sep 27, 2026.

How we count, sources and notices

Where the money is going

Outside groups have reported $1.92B for or against 2026 candidates (including $1.13B counted from 24/48-hour notices); named spenders' purchases dated in the 4 weeks to Oct 4 come to $848.8M.
Outside spending through Oct 8, 2026; campaign totals mostly through Jun 30, 2026.

Outside money by week

Named purchases by week, for and against. Spenders that are not named are in the total above but not in this chart.
For a candidateAgainst a candidateDashed line: the week so far. Dotted verticals: reports due Oct 15 and Oct 22, Election Day Nov 3. Shaded: the days left
Traders on the ballot

91 incumbents on the ballot reported trades in the last 12 months; the largest by estimated volume, Rep. Jefferson Shreve (R, IN-6), reported 17 trades worth about $207.0M (est.), 50% of the $413.0M (est.) all of them reported.

We count an incumbent as on the November ballot only when an official list or result we cite names them, for their seat or as a Senate nominee. Until a list we have read names them or shows them out, an incumbent is not confirmed: counted neither as on the ballot nor as an open seat, even with a 2026 campaign on file. Trades in the 12 months to Oct 8, 2026; every volume is an estimate (est.).
Trades disclosed through Oct 7, 2026; campaign receipts mostly through Jun 30, 2026.

House reports filed as scanned images since Jun 4, 2026 are not yet included, so some House members' trade counts are low.

All races and states

Every race, every state

Races

Every state, ranked

The 50 states and DC, sorted by any column, with the territories at the foot (not ranked). The same figures the map shows. Pick a row to open that state. Unemployment: the state's rate, and its difference from the US rate for the same month.
Outside spending through Oct 8, 2026; campaign totals mostly through Jun 30, 2026; trades disclosed through Oct 7, 2026; federal awards FY2025; unemployment Aug 2026.

House reports filed as scanned images since Jun 4, 2026 are not yet included, so some House members' trade counts are low.

Every state, ranked by outside money; select a column header to sort
#
1TexasYes38 (13 open)$350.0Mn/a$168.8M949$73.1M est.36n/a4.4% (+0.3)7
2MichiganYes13 (3 open)$218.9Mn/a$70.3M506$5.3M est.3n/a5.0% (+0.9)4
3OhioSpecial15 (0 open, plus 1 not yet confirmed)$200.0Mn/a$91.1M237$2.5M est.11n/a3.3% (-0.8)2
4IowaYes4 (2 open)$107.9Mn/a$45.5M0None0n/a3.2% (-0.9)7
5North CarolinaYes14 (1 open)$94.0Mn/a$80.4M77$3.1M est.0n/a3.5% (-0.6)5
6MaineYes2 (1 open)$82.2Mn/a$20.4M17$301K est.1n/a3.2% (-0.9)8
7KentuckyYes6 (2 open)$75.8Mn/a$27.2M7$81K est.0n/a4.7% (+0.6)15
8New YorkNo26 (5 open, plus 2 not yet confirmed)$74.8Mn/a$145.2M20$797K est.0n/a4.3% (+0.2)9
9CaliforniaNo52 (4 open)$71.1Mn/a$156.7M4,701$169.0M est.72n/a5.1% (+1.0)16
10AlaskaYes1 (0 open)$65.3Mn/a$34.5M2$550K est.0n/a4.3% (+0.2)18
11IllinoisYes17 (2 open, plus 7 not yet confirmed)$57.5Mn/a$62.6M52$1.5M est.0n/a4.7% (+0.6)4
12FloridaSpecial28 (7 open)$53.6Mn/a$90.5M348$9.8M est.3n/a4.5% (+0.4)10
13New HampshireYes2 (1 open)$50.7Mn/a$35.9M0None0n/a2.8% (-1.3)8
14GeorgiaYes14 (4 open)$43.4Mn/a$113.5M127$5.5M est.8n/a3.2% (-0.9)6
15South CarolinaYes7 (2 open)$28.5Mn/a$21.5M76$3.2M est.1n/a4.1% (0.0)5
16AlabamaYes7 (1 open)$28.3Mn/a$16.3M25$561K est.6n/a3.4% (-0.7)5
17MinnesotaYes8 (1 open)$28.2Mn/a$40.7M57$3.3M est.4n/a4.4% (+0.3)6
18PennsylvaniaNo17 (0 open, plus 3 not yet confirmed)$27.2Mn/a$67.1M338$66.5M est.1n/a3.7% (-0.4)2
19LouisianaYes6 (2 open)$27.2Mn/a$47.2M139$4.9M est.17n/a4.2% (+0.1)7
20NebraskaYes3 (1 open)$25.7Mn/a$26.5M1$8K est.0n/a2.9% (-1.2)12
21MontanaYes2 (1 open)$24.7Mn/a$10.7M2$83K est.2n/a3.2% (-0.9)13
22ColoradoYes8 (1 open)$24.2Mn/a$49.3M7$583K est.0n/a4.0% (-0.1)4
23New JerseyYes12 (1 open)$19.1Mn/a$51.7M210$8.1M est.0n/a4.3% (+0.2)3
24ArizonaNo9 (0 open, plus 5 not yet confirmed)$17.4Mn/a$54.8M2$208K est.0n/a4.9% (+0.8)8
25VirginiaYes11 (0 open)$13.9Mn/a$64.8M44$1.7M est.0n/a3.6% (-0.5)6
26MarylandNo8 (1 open)$13.1Mn/a$28.1M360$8.4M est.0n/a4.1% (0.0)1
27KansasYes4 (0 open)$12.8Mn/a$17.7M7$81K est.0n/a3.8% (-0.3)14
28WisconsinNo8 (1 open, plus 1 not yet confirmed)$12.1Mn/a$29.4M45$9.9M est.0n/a3.2% (-0.9)2
29MassachusettsYes9 (1 open, plus 1 not yet confirmed)$11.1Mn/a$29.0M46$4.6M est.0n/a4.3% (+0.2)3
30MissouriNo8 (1 open)$10.8Mn/a$19.8M19$2.3M est.0n/a3.5% (-0.6)14
31WyomingYes1 (1 open)$8.4Mn/a$4.1M0None0n/a3.0% (-1.1)2
32WashingtonNo10 (1 open)$8.2Mn/a$27.7M108$7.8M est.0n/a4.9% (+0.8)11
33UtahNo4 (1 open)$5.4Mn/a$7.6M25$901K est.0n/a3.5% (-0.6)2
34ArkansasYes4 (0 open)$5.0Mn/a$19.7M186$2.0M est.6n/a3.9% (-0.2)7
35MississippiYes4 (0 open)$4.5Mn/a$10.7M10$80K est.3n/a3.4% (-0.7)9
36NevadaNo4 (1 open)$4.2Mn/a$18.8M3$24K est.0n/a4.8% (+0.7)1
37OklahomaYes5 (1 open)$3.9Mn/a$19.4M892$45.5M est.693n/a4.3% (+0.2)11
38TennesseeYes9 (3 open)$3.6Mn/a$29.5M120$8.4M est.1n/a3.4% (-0.7)16
39ConnecticutNo5 (1 open)$2.6Mn/a$8.4M36$2.7M est.0n/a5.1% (+1.0)3
40New MexicoYes3 (0 open)$2.4Mn/a$14.1M0None0n/a4.7% (+0.6)6
41South DakotaYes1 (1 open)$1.6Mn/a$5.7M1$3.0M est.1n/a2.0% (-2.1)12
42IndianaNo9 (0 open)$1.3Mn/a$20.5M22$207.1M est.0n/a3.3% (-0.8)3
43West VirginiaYes2 (0 open)$625Kn/a$8.0M40$50.4M est.0n/a4.0% (-0.1)11
44OregonYes6 (0 open)$618Kn/a$15.3M1$8K est.0n/a5.1% (+1.0)6
45District of ColumbiaNoDelegate$308Kn/a$833K1$33K est.0n/a5.7% (+1.6)0
46HawaiiNo2 (0 open, plus 2 not yet confirmed)$100Kn/a$3.4M5$40K est.1n/a2.7% (-1.4)6
47DelawareYes1 (0 open)$12Kn/a$9.4M1$175K est.0n/a4.7% (+0.6)2
48IdahoYes2 (0 open)$6Kn/a$6.1M0None0n/a3.6% (-0.5)4
49Rhode IslandYes2 (0 open)<$1Kn/a$9.7M38$932K est.0n/a3.7% (-0.4)4
49VermontNo1 (0 open)<$1Kn/a$1.0M0None0n/a2.6% (-1.5)9
51North DakotaNo1 (0 open)$0n/a$1.9M0None0n/a2.2% (-1.9)9
Puerto RicoNoNone in 2026No federal raceNo federal raceNo federal race0None0$3,164 (2020 Census)6.1% (+2.0)4
GuamNoDelegate$0$0.00 (2020 Census)$168K0None0$26,794 (2020 Census)n/a2
U.S. Virgin IslandsNoDelegate$0$0.00 (2020 Census)$713K0None0$116,856 (2020 Census)n/a1
American SamoaNoDelegate$0$0.00 (2020 Census)$39K0None0$8,658 (2020 Census)n/a1
Northern Mariana IslandsNoDelegate$0$0.00 (2020 Census)$81K0None0$1,964 (2020 Census)n/a3
Balance of power

Republicans hold the Senate 53 to 47 and the House 218 to 214.

Seats as held today. Not a forecast. 35 seats on the ballot. Control takes 51 seats, or 50 plus the Vice President's tie-break (R). Democrats and the independents who caucus with them would need a net gain of 4; Republicans can lose 3 and keep control. All 435 seats on the ballot. 218 seats make a majority. 69 seats have no incumbent on the ballot; in 22 more the incumbent is not yet confirmed.
Senate 100 seats, 35 up
House 435 seats, all up, 2 vacant
  • 53 R, 45 D, 2 ISenate seats held
  • 35Senate seats up: 22 R, 13 D
  • 82Open seats: 13 Senate, 69 House; plus 1 delegate race. 22 more not yet confirmed (0 Senate, 22 House)
  • FL, OHSpecial Senate elections
  • 4Appointed senators
  • 5 upDelegates; PR not up

How we count

KeyVex does not rate races, publish odds or call results. Colors show money, trades or who holds a seat today, never who will win. Every figure comes from a public record: FEC filings, congressional disclosures, USAspending.gov, BLS and FEMA. Trade volumes and net worth are estimates (est.) from the ranges filed.

Read the full method
Campaign money
Total receipts each 2026 House and Senate campaign reported to the FEC for the 2025-26 two-year period: the figure fec.gov shows when the 2026 two-year period is selected (a senator's candidate page opens on the six-year term, which also counts earlier years). Receipts include money transferred from a candidate's other committees, such as a joint fundraising committee or an earlier campaign. State and national totals subtract transfers between committees we already count, so no dollar is counted twice. A candidate with two FEC IDs is counted once. Totals run through each campaign's latest report; most run through June 30, 2026. Third-quarter reports (through September 30) are due October 15 and pre-general reports (through October 14) are due October 22.
Leading campaigns
The Democratic and the Republican campaign with the most receipts (the incumbent's, where the incumbent is on the ballot), plus any other campaign with at least 15% of the race leader's receipts. Where we cite an official list of the November ballot (most Senate races, and California's and Washington's House races, where two candidates of one party can meet), the candidates on it. Where a rival of the incumbent's own party raised more than the incumbent and no official source we cite settles the primary, both are listed. Other races can include candidates who lost a primary.
Outside money
Independent expenditures reported to the FEC for or against 2026 House and Senate candidates since January 1, 2025, from KeyVex's copy of FEC Schedule E: every line a filer reports, including purchases under $1,000 (amounts under $1,000 are shown as <$1K). A purchase reported on a 24- or 48-hour notice and again on a regular report is counted once, from the notice until KeyVex's copy has the regular report. Notices can be revised, and totals that include them can run ahead of FEC's own figures. Spenders that may be individuals are not named; their totals appear as one unnamed line and are left out of the weekly chart and the list of recent spending. Purchases for an earlier election, such as a 2025 special election, and purchases dated after Election Day are left out. Coordinated party spending is not included.
Trades
Periodic transaction reports filed with the Senate and the House (stocks, funds, bonds, notes and other securities), by trade date, for the 12 months to Oct 8, 2026. Dollar figures are midpoints of the ranges filed, so every volume is an estimate (est.). A Senate trade restated by an amendment, and a House trade on a re-filed report we have identified, is counted once; House amendments carry no marker, so a House trade filed again on a later report can be counted twice. Trades our identity check could not tie to the member are left out, and names with apostrophes are not yet matched, so some totals are low.
Disclosed more than 45 days after the trade
Counted from the first report that listed the trade. The law sets 45 days after the transaction as the outer limit for reporting; this compares two dates printed on the filings and is not a finding that any law was broken. Dates more than two years apart are treated as a likely typo, listed as dates to verify and not counted.
Net worth (est.)
KeyVex's estimate from the member's latest annual financial disclosure: the midpoint of the listed asset ranges less the midpoint of the listed debts. The form does not list a member's home. Where the ranges cannot support a figure above zero we say why instead of showing a number.
Seats and status
Members from the congress-legislators roster, compiled from official sources, as of Sep 27, 2026. We count an incumbent as on the November ballot only when an official list or result we cite names them, for their seat or as a Senate nominee. Until a list we have read names them or shows them out, an incumbent is not confirmed: counted neither as on the ballot nor as an open seat, even with a 2026 campaign on file. A seat is listed as open when an official source we cite says the incumbent is not on the ballot, when the FEC lists the race as an open seat and the incumbent has no 2026 campaign of their own, when no incumbent filed for the district under its 2026 lines, or when the seat is vacant. Otherwise the incumbent is not confirmed, and we say what the FEC shows: a 2026 campaign on file, or none. Candidates on the November ballot are listed only with a link to an official election office's candidate list, ballot or results; "Nominee" marks a party's nominee, and candidates on Alaska's top-four ballot, California's and Washington's top-two ballots, or on the ballot by petition are marked "On the ballot".
Federal money
Fiscal year 2025 federal award obligations by place of performance, from USAspending.gov. The map and the table rank contracts, grants and other assistance per resident, using Census Bureau July 2025 population estimates (2020 Census counts for Puerto Rico, Guam, the Virgin Islands, American Samoa and the Northern Mariana Islands). Direct payments are shown apart in each state's report and left out of the ranking: USAspending can record some of them, including Medicare payments, where the contractor or insurer that pays them is located rather than where the people paid live. Loans are shown separately at face value.
Disasters
Major disaster declarations (FEMA declaration type DR) since 2021, counted once per disaster.
Unemployment
Bureau of Labor Statistics, Local Area Unemployment Statistics, seasonally adjusted, latest month (preliminary). National rate from the Current Population Survey.
District lines
Nine states use new district lines in 2026: Alabama, California, Florida, Louisiana, North Carolina, Ohio, Tennessee, Texas and Utah. Missouri's new map is not in effect. Races follow the district each candidate filed for with the FEC.
Louisiana
Each Louisiana House race is an open primary on Nov 3, with a runoff on Dec 12 if no one wins a majority: every candidate on that ballot is marked "On the ballot".

Sources

Ballot facts from the official candidate lists, the oldest read Oct 7, 2026. Roster as of Sep 27, 2026. Government statistics fetched Oct 7, 2026; FEMA declarations through Oct 2, 2026. Nothing here is a forecast or a recommendation.

Notices

  • This product uses Census Bureau data but is not endorsed or certified by the Census Bureau.
  • This product uses the FRED® API but is not endorsed or certified by the Federal Reserve Bank of St. Louis. FRED® API Terms of Use
  • BLS.gov cannot vouch for the data or analyses derived from these data after the data have been retrieved from BLS.gov.
  • This product uses the Federal Emergency Management Agency's OpenFEMA API, but is not endorsed by FEMA. The Federal Government or FEMA cannot vouch for the data or analyses derived from these data after the data have been retrieved from the Agency's website(s).
  • Federal spending: USAspending.gov, U.S. Department of the Treasury.
  • State boundaries: U.S. Census Bureau cartographic boundary files via us-atlas (ISC license, copyright Michael Bostock).