

Michigan
At a glance
House reports filed as scanned images since Jun 4, 2026 are not yet included, so some House members' trade counts are low.
Source: FEC Schedule E through Oct 8, 2026 and FEC campaign reports (2025-26 receipts), mostly through Jul 15, 2026; Senate and House periodic transaction reports disclosed through Oct 7, 2026; USAspending.gov (FY2025) and Census Bureau population estimates (Vintage 2025), as of Oct 8, 2026. How we count
Senate (Class II)
On the November ballot
Top spenders
For
- WinsenateSuper PAC · 8 purchases · latest Sep 29, 2026$2.7M filing
- Fighting for Michigan PACSuper PAC · 18 purchases · latest Jul 29, 2026$1.9M filing
- LCV Victory FundSuper PAC · 3 purchases · latest Sep 30, 2026$589K filing
- National Nurses United for Patient ProtectionSuper PAC · 2 purchases · latest Jun 29, 2026$490K filing
- Unity & Justice FundSuper PAC · 30 purchases · latest Sep 19, 2026$440K filing
Against
- SLF PACSuper PAC · 43 purchases · latest Oct 2, 2026$27.4M filing
- United Democracy Project ('UDP')Super PAC · 25 purchases · latest Aug 3, 2026$20.1M filing
- No Going Back PAC Inc.Super PAC · 10 purchases · latest Oct 2, 2026$16.6M filing
- Americans for Prosperity Action, Inc. (AFP Action)Hybrid PAC · 37 purchases · latest Oct 6, 2026$7.6M filing
- America PACSuper PAC · 38 purchases · latest Oct 6, 2026$3.1M filing
Top spenders
For
- Americans for Prosperity Action, Inc. (AFP Action)Hybrid PAC · 81 purchases · latest Oct 6, 2026$12.6M filing
- GLCF, Inc.Super PAC · 15 purchases · latest Sep 28, 2026$10.7M filing
- The Sentinel Action FundSuper PAC · 24 purchases · latest Oct 1, 2026$2.9M filing
- America PACSuper PAC · 35 purchases · latest Oct 6, 2026$2.0M filing
- SLF PACSuper PAC · 12 purchases · latest Jun 4, 2026$1.1M filing
Against
- WinsenateSuper PAC · 24 purchases · latest Oct 3, 2026$13.6M filing
- Defend the VoteHybrid PAC · 4 purchases · latest Sep 21, 2026$4.6M filing
- Edf Action VotesSuper PAC · 5 purchases · latest Aug 11, 2026$1.8M filing
- LCV Victory FundSuper PAC · 6 purchases · latest Sep 4, 2026$1.5M filing
- Planned Parenthood VotesSuper PAC · 11 purchases · latest Aug 20, 2026$1.1M filing
Source: FEC campaign reports, 2025-26 receipts (through Jul 15, 2026); FEC Schedule E through Oct 8, 2026; Senate disclosures for the incumbent's trades and net worth, as of Oct 8, 2026. How we count
House races
Each race shows the candidates on its official November list. Open a row for its campaigns: raised spent cash on hand, on one scale per race, through Jul 15, 2026 unless another date is shown.
District 1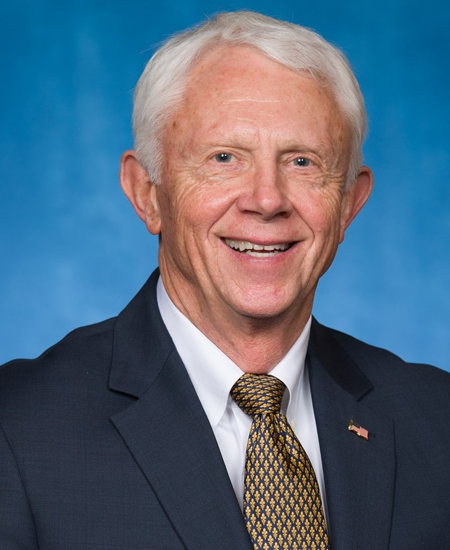 Jack Bergman RNomineeJack Bergman R $1.9M / $660KCallie Barr D $824K / $531KArnett Satterla Libertarian n/a / n/aDoc Kovaly U.S. Taxpayers Party n/a / n/a$19K00
Jack Bergman: Nominee source. No trades in the last 12 months. Trades and net worth
- Jack Bergman R Incumbent$1.9M raised · $1.4M spent · $660K cashincludes $667K transferred from the candidate's other committees · from PACs 39%Outside money: against $0, for $19K, includes $6K from 24/48-hour notices. Top for: National Association of Realtors Political Action Committee $13K, Right to Life of Michigan Victory Fund $6K.
- Callie Barr D$824K raised · $301K spent · $531K cashfrom PACs 8%
- Arnett Satterla LibertarianRegistered; no financial report on file yet
- Doc Kovaly U.S. Taxpayers Party No FEC filing on file
- Laveta Davenport Green Registered; no financial report on file yet
- Liz Hakola Working Class Party Registered; no financial report on file yet
- Zebulon Hart Featherly I Registered; no financial report on file yet
District 2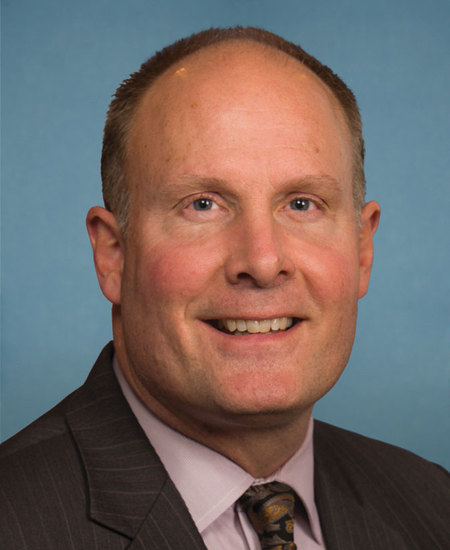 John R. Moolenaar RNomineeJohn R. Moolenaar R $1.7M / $1.9MBenjamin Ambrose D $85K / $22KCharlotte Irene Magoon Green n/a / n/aRichard Sills Natural Law Party n/a / n/a<$1K00
John R. Moolenaar: Nominee source. No trades in the last 12 months. Trades and net worth
- John R. Moolenaar R Incumbent$1.7M raised · $1.0M spent · $1.9M cashfrom PACs 33% · debts $27KOutside money: against $0, for <$1K. Top for: Right to Life of Michigan Victory Fund <$1K.
- Benjamin Ambrose D$85K raised · $63K spent · $22K cash
- Charlotte Irene Magoon GreenRegistered; no financial report on file yet
- Richard Sills Natural Law Party Registered; no financial report on file yet
District 3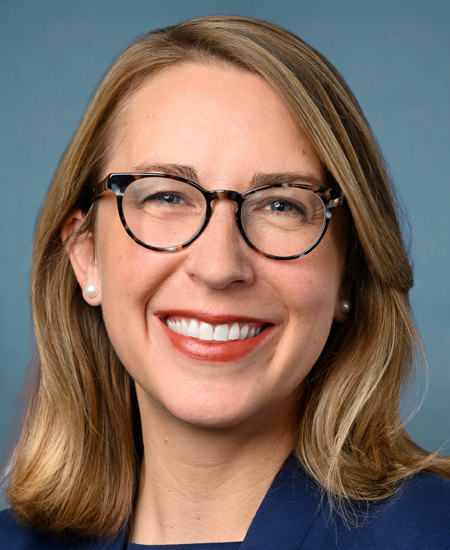 Hillary J. Scholten DNomineeHillary J. Scholten D $2.3M / $1.4MTerri Deboer R $552K / $361KJoe Jock Green n/a / n/a$806K00
Hillary J. Scholten: Nominee source. No trades in the last 12 months. Trades and net worth
- Hillary J. Scholten D Incumbent$2.3M raised · $1.3M spent · $1.4M cashfrom PACs 30%Outside money: against $537K, for $18K, includes $555K from 24/48-hour notices. Top for: Community Change Voters $18K, Givegreen United Action <$1K. Top against: West Michigan for Common Sense $537K.
- Terri Deboer R$552K raised · $190K spent · $361K cashincludes $91K transferred from the candidate's other committees · from PACs 2% · debts $20KOutside money: against $0, for $251K, includes $251K from 24/48-hour notices. Top for: West Michigan for Common Sense $251K.
- Joe Jock GreenRegistered; no financial report on file yet
District 4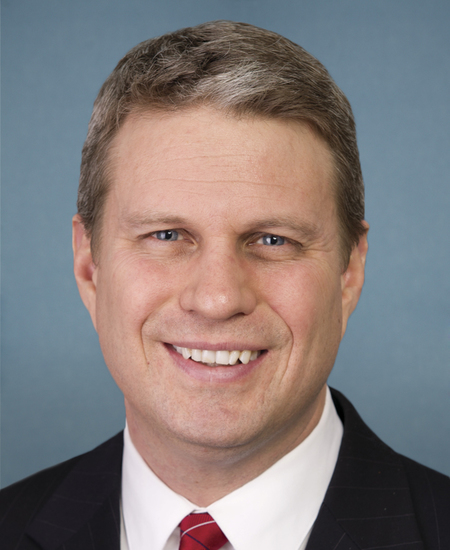 Bill Huizenga RNomineeBill Huizenga R $4.1M / $2.3MSean McCann D $2.6M / $1.7MShafina Che Barnett Green n/a / n/a$10.9M00
Bill Huizenga: Nominee source. No trades in the last 12 months. Trades and net worth
- Bill Huizenga R Incumbent$4.1M raised · $1.9M spent · $2.3M cashincludes $844K transferred from the candidate's other committees · from PACs 39%Outside money: against $5.4M, for $878K, includes $4.7M from 24/48-hour notices. Top for: Defend American Jobs $512K, No Going Back PAC Inc. $314K. Top against: HMP $1.8M, LCV Victory Fund $990K. Against: 1 filer not named: $4K.
- Sean McCann D$2.6M raised · $934K spent · $1.7M cashfrom PACs 12%Outside money: against $4.3M, for $272K, includes $4.5M from 24/48-hour notices. Top for: Millions of Michiganians $114K, Somos PAC $64K. Top against: No Going Back PAC Inc. $3.8M, Thank You for Your Attention to This Matter PAC $363K. For: 1 filer not named: $4K.
- Shafina Che Barnett GreenRegistered; no financial report on file yet
District 5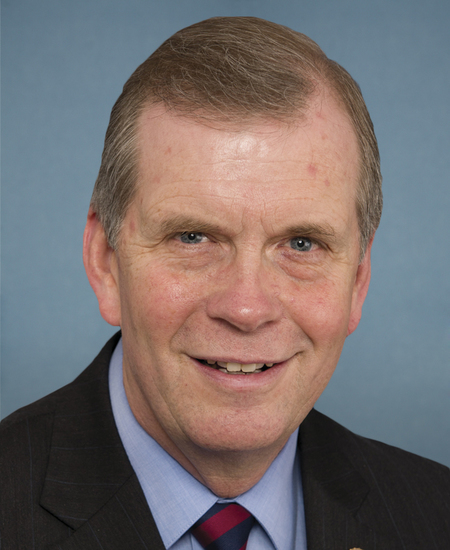 Tim Walberg RNomineeTim Walberg R $1.7M / $994KChristian A Vukasovich D $56K / $13KJames Bronke Green n/a / n/aRonald A Muszynski Libertarian n/a / n/a<$1K2$41K est.1
Tim Walberg: Nominee source. 2 trades in the last 12 months, $41K est., 1 disclosed more than 45 days after the trade. Trades and net worth
- Tim Walberg R Incumbent$1.7M raised · $1.7M spent · $994K cashfrom PACs 45%Outside money: against $0, for <$1K. Top for: Right to Life of Michigan Victory Fund <$1K.
- Christian A Vukasovich D$56K raised · $42K spent · $13K cash
- James Bronke GreenRegistered; no financial report on file yet
- Ronald A Muszynski Libertarian Registered; no financial report on file yet
- Sharon Marie Renier U.S. Taxpayers Party Registered; no financial report on file yet
District 6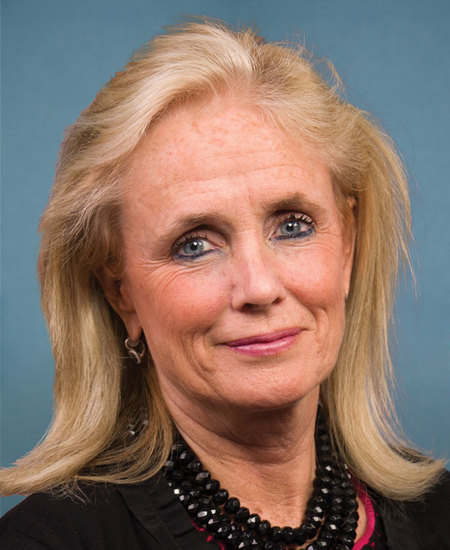 Debbie Dingell DNomineeDebbie Dingell D $1.2M / $415KClyde K Shabazz Green n/a / n/aHeather Smiley R n/a / n/aLinda Rayburn Working Class Party n/a / n/a<$1K12$420K est.0
Debbie Dingell: Nominee source. 12 trades in the last 12 months, $420K est. Trades and net worth
- Debbie Dingell D Incumbent$1.2M raised · $1.1M spent · $415K cashfrom PACs 58%Outside money: against $0, for <$1K. Top for: Sierra Club Independent Action <$1K.
- Clyde K Shabazz GreenRegistered; no financial report on file yet
- Heather Smiley RRegistered; no financial report on file yet
- Linda Rayburn Working Class Party Registered; no financial report on file yet
- Michael Raymond Mickevicius U.S. Taxpayers Party Registered; no financial report on file yet
- Timothy A. Teagan Libertarian Registered; no financial report on file yet
District 7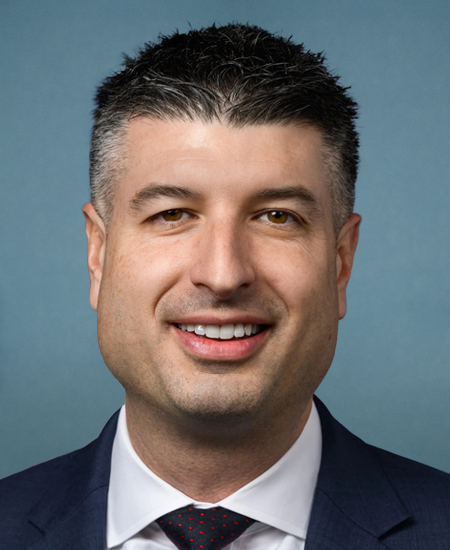 Tom Barrett RNomineeTom Barrett R $6.3M / $2.9MWilliam Lawrence D $1.1M / $383KShane Dedrick Green n/a / n/a$9.3M00
Tom Barrett: Nominee source. No trades in the last 12 months. Trades and net worth
- Tom Barrett R Incumbent$6.3M raised · $3.5M spent · $2.9M cashincludes $1.5M transferred from the candidate's other committees · from PACs 23% · debts $3KOutside money: against $3.1M, for $1.1M, includes $4.0M from 24/48-hour notices. Top for: Americans for Prosperity Action, Inc. (AFP Action) $515K, America First Agriculture Action Inc. $359K. Top against: HMP $2.3M, NRDC Action Votes $300K. Against: 1 filer not named: $6K.
- William Lawrence D$1.1M raised · $736K spent · $383K cashfrom PACs 4% · debts $10KOutside money: against $3.0M, for $2.1M, includes $3.5M from 24/48-hour notices. Top for: National Nurses United for Patient Protection $800K, Michigan Sunrise PAC $497K. Top against: Rolling Sea Action Fund $1.0M, Crush MAGA PAC $909K. For: 1 filer not named: $13K.
- Shane Dedrick GreenRegistered; no financial report on file yet
District 8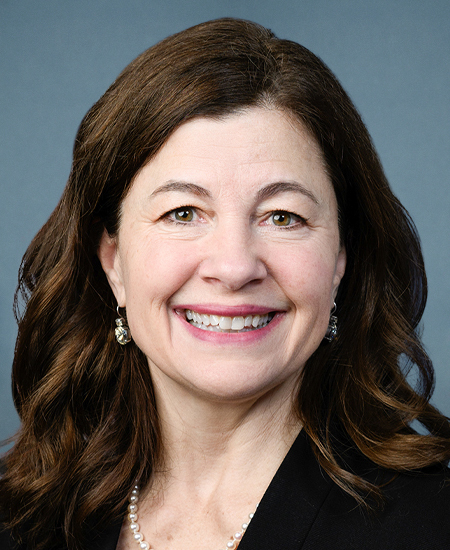 Kristen McDonald Rivet DNomineeKristen McDonald Rivet D $5.6M / $4.3MThomas James Smith R $243K / $220KC. Mia Pettus Libertarian n/a / n/aJim Casha Green n/a / n/a$555K00
Kristen McDonald Rivet: Nominee source. No trades in the last 12 months. Trades and net worth
- Kristen McDonald Rivet D Incumbent$5.6M raised · $1.4M spent · $4.3M cashfrom PACs 27%Outside money: against $177K, for $225K, includes $389K from 24/48-hour notices. Top for: Rolling Sea Action Fund $150K, Charter Schools Action PAC $54K. Top against: America PAC $85K, No Going Back PAC Inc. $80K.
- Thomas James Smith R$243K raised · $23K spent · $220K cashthrough Aug 24, 2026 · includes $233K transferred from the candidate's other committees · debts $8KOutside money: against $0, for $153K, includes $153K from 24/48-hour notices. Top for: No Going Back PAC Inc. $78K, America PAC $75K.
- C. Mia Pettus LibertarianRegistered; no financial report on file yet
- Jim Casha Green Registered; no financial report on file yet
- Kathy Goodwin Working Class Party Registered; no financial report on file yet
District 9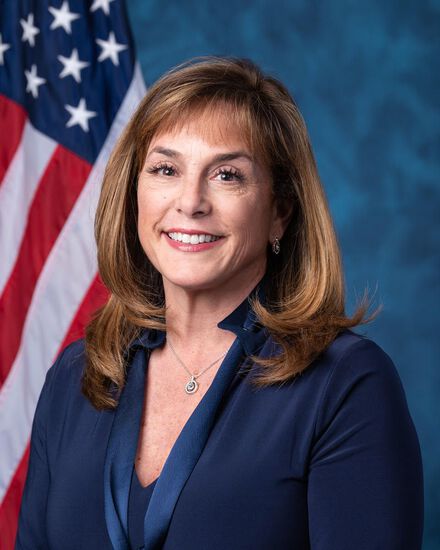 Lisa C. McClain RNomineeLisa C. McClain R $5.2M / $1.5MSteven Raymond Pooley D $8K / $5KDestiny Clayton Green n/a / n/aJim Walkowicz Working Class Party n/a / n/a<$1K478$4.4M est.0
Lisa C. McClain: Nominee source. 478 trades in the last 12 months, $4.4M est. Trades and net worth
- Lisa C. McClain R Incumbent$5.2M raised · $4.3M spent · $1.5M cashincludes $1.1M transferred from the candidate's other committees · from PACs 28%Outside money: against $0, for <$1K. Top for: Right to Life of Michigan Victory Fund <$1K.
- Steven Raymond Pooley D$8K raised · $3K spent · $5K cash
- Destiny Clayton GreenRegistered; no financial report on file yet
- Jim Walkowicz Working Class Party Registered; no financial report on file yet
- John Vlahos U.S. Taxpayers Party Registered; no financial report on file yet
- Kevin Vayko Libertarian Registered; no financial report on file yet
District 10Open seat outgoing: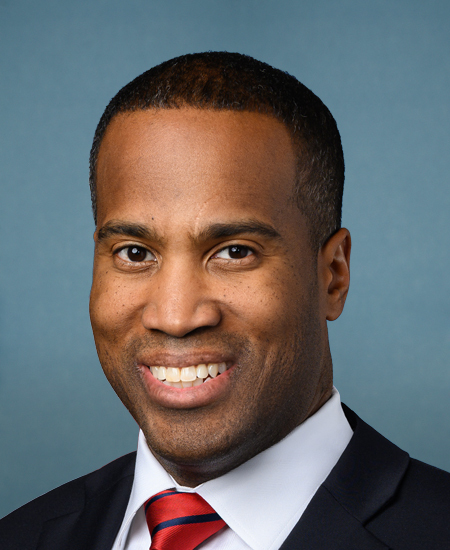 John James RNot on the November ballotMichael Bouchard R $1.6M / $1.1MChristina Hines D $1.2M / $158KAndrea Kirby Working Class Party n/a / n/aKwabena Nkromo Green n/a / n/a$4.4M1$33K est.0
John James: Not on the November ballot source. 1 trade in the last 12 months, $33K est. Trades and net worth
- Michael Bouchard R$1.6M raised · $479K spent · $1.1M cashthrough Aug 19, 2026 · includes $209K transferred from the candidate's other committees · from PACs 8% · debts $124KOutside money: against $1.4M, for $415K, includes $1.7M from 24/48-hour notices. Top for: Honor, Duty & Discipline PAC $232K, No Going Back PAC Inc. $82K. Top against: American Federation of State County & Municipal Employees P E O P L E $460K, HMP $379K.
- Christina Hines D$1.2M raised · $1.1M spent · $158K cashfrom PACs 6%Outside money: against $1.3M, for $1.3M, includes $2.0M from 24/48-hour notices. Top for: Pro-Choice Majority Action $500K, HMP $243K. Top against: Restoration of America PAC $1.1M, America PAC $109K.
- Andrea Kirby Working Class PartyRegistered; no financial report on file yet
- Kwabena Nkromo Green No FEC filing on file
- Mike Saliba Libertarian Registered; no financial report on file yet
District 11Open seat outgoing: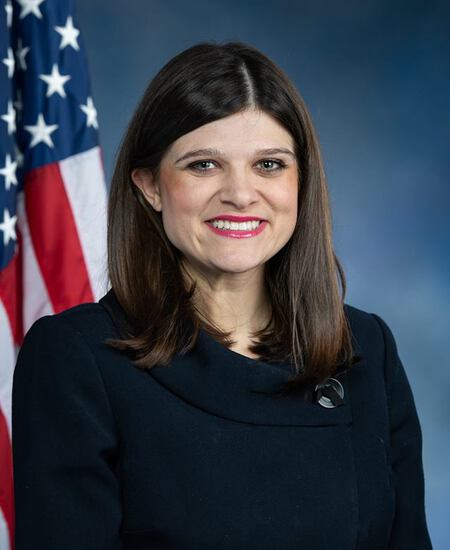 Haley M. Stevens DNot on the November ballotJeremy Moss D $1.5M / $353KAnil Kumar I $713K / $408KEthan D Baker R $142K / $121KFarid Ishac Libertarian n/a / n/a$420K00
Haley M. Stevens: Not on the November ballot source. No trades in the last 12 months. Trades and net worth
- Jeremy Moss D$1.5M raised · $1.1M spent · $353K cashfrom PACs 10%Outside money: against $20K, for $400K, includes $125K from 24/48-hour notices. Top for: Think Big $295K, Equality PAC $105K. Top against: Integrity PAC $20K.
- Anil Kumar I$713K raised · $307K spent · $408K cashthrough Jun 30, 2026 · self-funded 87% · debts $595K
- Ethan D Baker R$142K raised · $22K spent · $121K cash
- Farid Ishac Libertarian Registered; no financial report on file yet
- Ryan Teasdale Green Registered; no financial report on file yet
District 12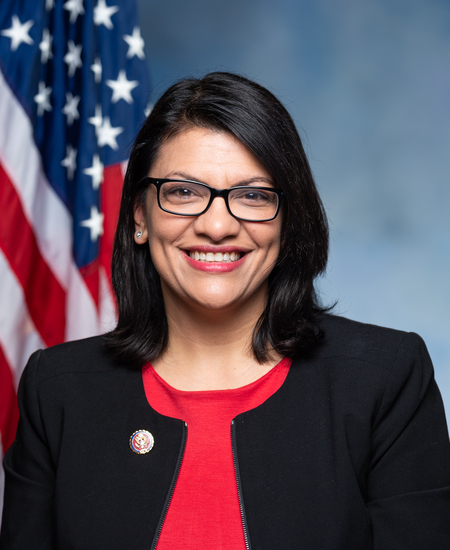 Rashida Tlaib DNomineeRashida Tlaib D $2.8M / $3.4MJames D Hooper R <$1K / $8KBrenda K. Sanders Green n/a / n/aGary Walkowicz Working Class Party n/a / n/a$11K00
Rashida Tlaib: Nominee source. No trades in the last 12 months. Trades and net worth
- Rashida Tlaib D Incumbent$2.8M raised · $3.6M spent · $3.4M cashincludes $348K transferred from the candidate's other committees · from PACs 1%Outside money: against $10K, for <$1K, includes $10K from 24/48-hour notices. Top for: Working Families Party PAC <$1K, Sierra Club Independent Action <$1K. Top against: Empowering Black Americans PAC $10K.
- James D Hooper R<$1K raised · $1K spent · $8K cashdebts <$1K
- Brenda K. Sanders GreenRegistered; no financial report on file yet
- Gary Walkowicz Working Class Party Registered; no financial report on file yet
- Marc Sosnowski U.S. Taxpayers Party Registered; no financial report on file yet
District 13Open seat outgoing: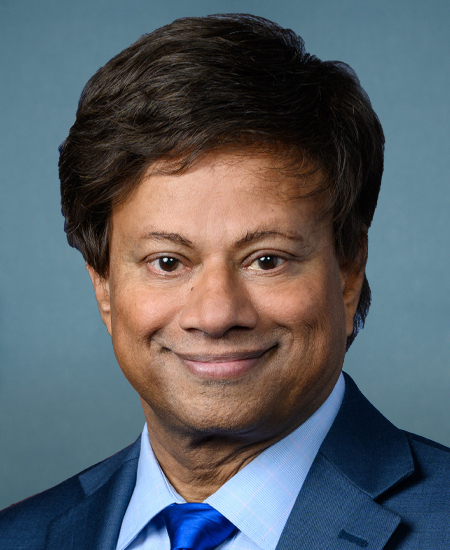 Shri Thanedar DNot on the November ballotDonavan McKinney D $1.4M / $143KChristopher Dardzinski U.S. Taxpayers Party n/a / n/aRaelyn Light Green n/a / n/aSimone R. Coleman Working Class Party n/a / n/a$1.9M2$208K est.2
Shri Thanedar: Not on the November ballot source. 2 trades in the last 12 months, $208K est., 2 disclosed more than 45 days after the trade. Trades and net worth
- Donavan McKinney D$1.4M raised · $1.2M spent · $143K cashfrom PACs 7%Outside money: against $269K, for $1.6M, includes $625K from 24/48-hour notices. Top for: Justice Democrats PAC $461K, National Nurses United for Patient Protection $400K. Top against: Protect Progress $269K.
- Christopher Dardzinski U.S. Taxpayers PartyRegistered; no financial report on file yet
- Raelyn Light GreenRegistered; no financial report on file yet
- Simone R. Coleman Working Class Party No FEC filing on file
- T.P. Nykoriak R Registered; no financial report on file yet
Source: FEC campaign reports, 2025-26 receipts (mostly through Jul 15, 2026, each campaign through its latest report); FEC Schedule E through Oct 8, 2026; House disclosures for incumbents' trades, as of Oct 8, 2026. How we count
The delegation's own money
House reports filed as scanned images since Jun 4, 2026 are not yet included, so some House members' trade counts are low.
Estimated volume by member (12 mo)
Lisa C. McClain R$4.4M est.Debbie Dingell D$420K est.Gary C. Peters D$211K est.Shri Thanedar D$208K est.Tim Walberg R$41K est.John James R$33K est.No trades in the last 12 months: Bill Huizenga, Elissa Slotkin, Haley M. Stevens, Hillary J. Scholten, Jack Bergman, John R. Moolenaar, Kristen McDonald Rivet, Rashida Tlaib, Tom Barrett










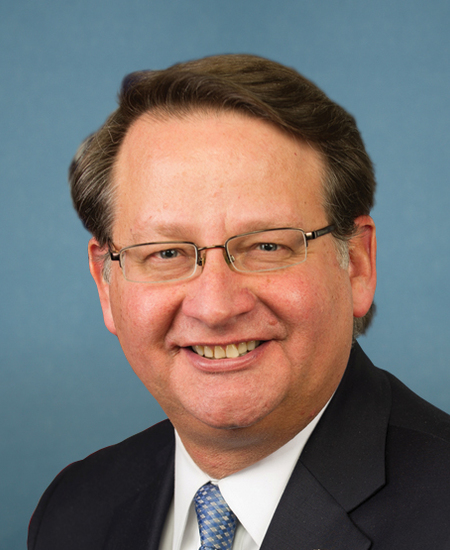
1 trade disclosed more than 45 days after the trade
- UA $1,001 - $15,000Traded Feb 10, 2026, first disclosed Jun 3, 2026, 113 days · filing
No trades in the last 12 months
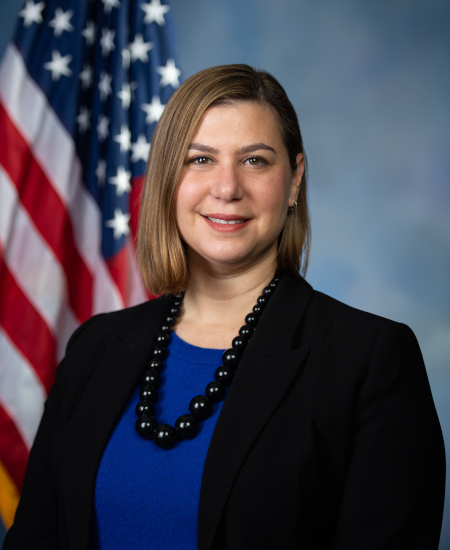
No trades in the last 12 months
No trades in the last 12 months
No trades in the last 12 months
No trades in the last 12 months
No trades in the last 12 months
No trades in the last 12 months
No trades in the last 12 months
No trades in the last 12 months
- Names with apostrophes are not yet matched, so some members may be under-counted.
Source: Senate eFD and House Clerk periodic transaction reports, trades dated Oct 8, 2025 to Oct 8, 2026, disclosed through Oct 7, 2026; annual financial disclosures for net worth, as of Oct 8, 2026. How we count
Federal money, disasters, jobs
Federal money, fiscal year 2025
Direct payments: $86.02B. Not in the comparison above: USAspending can record some of them, including Medicare payments, where the contractor or insurer that pays them is located rather than where the people paid live.
Loans (face value): $78.92B
FEMA major disasters since 2021
Unemployment rate
Source: USAspending.gov, FY2025 (fetched Oct 7, 2026); Census Bureau Vintage 2025 estimates; OpenFEMA, through Oct 2, 2026; BLS Local Area Unemployment Statistics, through Aug 2026; US rate from the Current Population Survey, through Sep 2026, as of Oct 8, 2026. How we count
- This product uses Census Bureau data but is not endorsed or certified by the Census Bureau.
- This product uses the FRED® API but is not endorsed or certified by the Federal Reserve Bank of St. Louis. FRED® API Terms of Use
- BLS.gov cannot vouch for the data or analyses derived from these data after the data have been retrieved from BLS.gov.
- This product uses the Federal Emergency Management Agency's OpenFEMA API, but is not endorsed by FEMA. The Federal Government or FEMA cannot vouch for the data or analyses derived from these data after the data have been retrieved from the Agency's website(s).
- Federal spending: USAspending.gov, U.S. Department of the Treasury.
Notes on Michigan
KeyVex does not rate races, publish odds or call results. Colors show money, trades or who holds a seat today, never who will win.
FEC bulk files fetched Oct 8, 2026; campaign totals mostly through Jun 30, 2026; outside spending since Jan 1, 2025, through Oct 8, 2026.
Trades dated Oct 8, 2025 to Oct 8, 2026, disclosed through Oct 7, 2026.
Ballot facts from the official candidate lists, the oldest read Oct 7, 2026; roster as of Sep 27, 2026.
- FEC bulk data: House and Senate current campaigns (webl26) and candidate master (cn26) fetched Oct 8, 2026; most campaigns report through Jun 30, 2026 (Public domain (U.S. government work))
- FEC Schedule E independent expenditures (KeyVex's copy) as of Oct 8, 2026 (Public domain (U.S. government work))
- Periodic transaction reports, Senate and House as of Oct 7, 2026 (Public record (Ethics in Government Act))
- Annual financial disclosure reports, Senate and House as of Oct 8, 2026 (Public record (Ethics in Government Act))
- Members of Congress (congress-legislators, compiled from official sources) as of Sep 27, 2026 (CC0)
- Census Bureau, Vintage 2025 state population estimates (NST-EST2025) (Public domain (U.S. government work))
- USAspending.gov, FY2025 award obligations by place of performance as of Oct 7, 2026 (Public domain (U.S. government work))
- Bureau of Labor Statistics, Local Area Unemployment Statistics (seasonally adjusted) as of Aug 2026 (Public domain (U.S. government work))
- Bureau of Labor Statistics, national unemployment rate (Current Population Survey) as of Sep 2026 (Public domain (U.S. government work))
- FEMA disaster declarations (OpenFEMA), major disasters (DR) as of Oct 2, 2026 (OpenFEMA terms)
- State boundaries: Census cartographic boundary files via us-atlas as of 2017 (ISC)