


SEI INVESTMENTS CO
 United States·USD
Congressional Trades
| Politician | Stock | Type | Filed | Traded | |
|---|---|---|---|---|---|
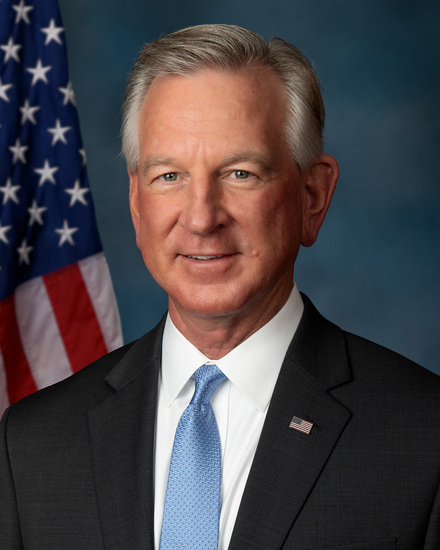 Tommy TubervilleSenate · R · AL |
SEICSEI INVESTMENTS CO · Stock |
Sale $1,001 - $15,000 |
Nov 10, 2022 | Oct 5, 2022 | Filing ↗ |
| Tommy TubervilleSenate · R · AL |
SEICSEI INVESTMENTS CO · Stock |
Purchase $1,001 - $15,000 |
Jul 23, 2021 | Mar 29, 2021 | Filing ↗ |
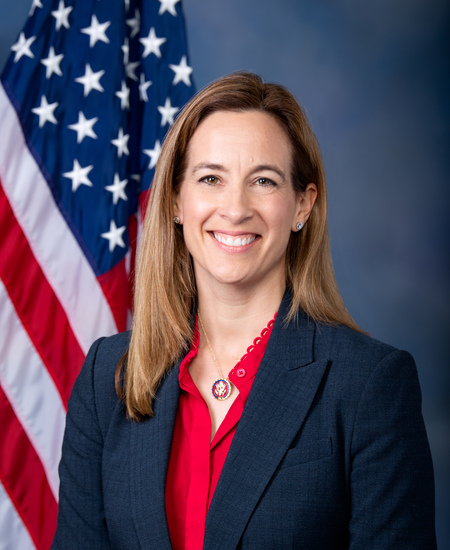 Mikie SherrillHouse · D · NJ |
SEICSEI INVESTMENTS CO · Stock |
Sale $1,001 - $15,000 |
Apr 5, 2020 | Feb 20, 2020 | Filing ↗ |
| Mikie SherrillHouse · D · NJ |
SEICSEI INVESTMENTS CO · Stock |
Purchase $1,001 - $15,000 |
Feb 19, 2020 | Jan 15, 2020 | Filing ↗ |
| Mikie SherrillHouse · D · NJ |
SEICSEI INVESTMENTS CO · Stock |
Sale $1,001 - $15,000 |
Jan 10, 2020 | Dec 12, 2019 | Filing ↗ |
Whale Activity
- Increased204
- New80
- Held111
- Decreased185
- Closed41
- No prior filing31
| Filer | Shares | Value | Change |
|---|---|---|---|
| BlackRock, Inc. | 10.8M | $1.11B | increased |
| LOOMIS SAYLES & CO L P | 7.8M | $803.0M | decreased |
| VANGUARD PORTFOLIO MANAGEMENT LLC | 6.2M | $634.7M | increased |
| VANGUARD CAPITAL MANAGEMENT LLC | 4.8M | $495.2M | increased |
| STATE STREET CORP | 4.3M | $438.8M | increased |
| MORGAN STANLEY | 4.3M | $438.2M | increased |
| Boston Partners | 3.4M | $348.1M | increased |
| GEODE CAPITAL MANAGEMENT, LLC | 3.1M | $318.3M | increased |
| LORD, ABBETT & CO. LLC | 2.9M | $299.1M | increased |
| BANK OF AMERICA CORP /DE/ | 2.8M | $285.9M | decreased |
| FMR LLC | 2.5M | $254.7M | decreased |
| DIMENSIONAL FUND ADVISORS LP | 2.0M | $208.6M | increased |
Every 13F filer's complete reported book, every quarter since 2013-06-30. 13F itself excludes short positions, cash and most options.
Insider Trading
Recent Insider Transactions
| Insider | Type | Shares | Price | Value | Date | |
|---|---|---|---|---|---|---|
| DORAN WILLIAMDirector · Director | Sale | −8,000 | $110.30 | $882K | Nov 10, 2026 | Form 4 ↗ |
| WEST ALFRED P JR | Sale | −5,483 | $103.16 | $566K | Sep 30, 2026 | Form 4 ↗ |
| WEST ALFRED P JR | Sale | −28.4K | $103.40 | $2.9M | Sep 29, 2026 | Form 4 ↗ |
| LANE MICHAELExecutive Vice President | Sale | −2,400 | $102.78 | $247K | Sep 22, 2026 | Form 4 ↗ |
| Hicke RyanChief Executive Officer | Sale | −37.5K | $110.71 | $4.2M | Sep 3, 2026 | Form 4 ↗ |
| Hicke RyanChief Executive Officer | Option exercise | +20.0K | $64.43 | $1.3M | Sep 3, 2026 | Form 4 ↗ |
| Hicke RyanChief Executive Officer | Option exercise | +17.5K | $48.47 | $848K | Sep 3, 2026 | Form 4 ↗ |
| ROMEO CARMENDirector | Sale | −5,000 | $109.70 | $549K | Sep 1, 2026 | Form 4 ↗ |
| ROMEO CARMENDirector | Option exercise | +5,000 | $49.63 | $248K | Sep 1, 2026 | Form 4 ↗ |
| Peterson MichaelExecutive Vice President | Sale | −37.5K | $111.51 | $4.2M | Aug 28, 2026 | Form 4 ↗ |
| Peterson MichaelExecutive Vice President | Option exercise | +37.5K | $56.54 | $2.1M | Aug 28, 2026 | Form 4 ↗ |
| McCabe PhilipSee Remarks | Sale | −5,043 | $105.50 | $532K | Aug 5, 2026 | Form 4 ↗ |
| McCabe PhilipSee Remarks | Option exercise | +5,043 | $49.63 | $250K | Aug 5, 2026 | Form 4 ↗ |
| McCabe PhilipSee Remarks | Sale | −25.0K | $105.04 | $2.6M | Aug 4, 2026 | Form 4 ↗ |
| McCabe PhilipSee Remarks | Option exercise | +15.0K | $49.63 | $744K | Aug 4, 2026 | Form 4 ↗ |
| McCabe PhilipSee Remarks | Option exercise | +9,957 | $49.63 | $494K | Aug 4, 2026 | Form 4 ↗ |
| MCCARTHY KATHRYNDirector | Sale | −10.0K | $103.54 | $1.0M | Aug 3, 2026 | Form 4 ↗ |
| MCCARTHY KATHRYNDirector | Option exercise | +5,000 | $71.12 | $356K | Aug 3, 2026 | Form 4 ↗ |
| MCCARTHY KATHRYNDirector | Option exercise | +5,000 | $71.12 | $356K | Aug 3, 2026 | Form 4 ↗ |
| Warner Mark AndrewSee Remarks* | Sale | −7,400 | $102.97 | $762K | Jul 28, 2026 | Form 4 ↗ |
Fund Holders
| Fund | Shares | Value | % of fund | As of |
|---|---|---|---|---|
| VANGUARD TOTAL STOCK MARKET INDEX FUND VANGUARD INDEX FUNDS | 3.4M | $301.3M | 0.01% | Jun 30, 2026 |
| iShares Core S&P Mid-Cap ETF iShares Trust | 3.1M | $274.4M | 0.22% | Jun 30, 2026 |
| Eaton Vance Atlanta Capital SMID-Cap Fund Eaton Vance Growth Trust | 2.7M | $238.0M | 2.71% | Jun 30, 2026 |
| VANGUARD SMALL-CAP INDEX FUND VANGUARD INDEX FUNDS | 2.5M | $217.8M | 0.12% | Jun 30, 2026 |
| Loomis Sayles Growth Fund LOOMIS SAYLES FUNDS II | 2.1M | $187.6M | 1.14% | Jun 30, 2026 |
| Disciplined Value Mid Cap Fund John Hancock Funds III | 2.0M | $178.9M | 0.77% | Jun 30, 2026 |
| VANGUARD SMALL-CAP VALUE INDEX FUND VANGUARD INDEX FUNDS | 1.6M | $137.9M | 0.20% | Jun 30, 2026 |
| LORD ABBETT AFFILIATED FUND INC | 1.0M | $106.8M | 1.56% | Jul 31, 2026 |
| VANGUARD EXTENDED MARKET INDEX FUND VANGUARD INDEX FUNDS | 1.0M | $91.9M | 0.09% | Jun 30, 2026 |
| Fidelity Low-Priced Stock Fund Fidelity Puritan Trust | 892.0K | $91.9M | 0.37% | Jul 31, 2026 |
Mutual funds and ETFs whose N-PORT filings list SEIC's shares (CUSIP 784117103), each fund at its latest report since Apr 21, 2026, largest positions first. Bonds, options and short positions are left out.
Activist & Passive Stakes
- Loomis, Sayles & Co., L.P.SCHEDULE 13G/A · passive (13G) · 7.8M shares6.5%
Nov 12, 2026 · ↗ - BlackRock, Inc.SCHEDULE 13G/A · passive (13G) · 9.4M shares7.9%
Oct 27, 2026 · ↗ - Loomis, Sayles & Co., L.P.SCHEDULE 13G/A · passive (13G) · 8.5M shares7.0%
Aug 14, 2026 · ↗ - Loomis, Sayles & Co., L.P.SCHEDULE 13G/A · passive (13G) · 8.7M shares7.1%
May 14, 2026 · ↗ - Loomis, Sayles & Co., L.P.SCHEDULE 13G/A · passive (13G) · 8.9M shares6.9%
Feb 12, 2025 · ↗
Corporate Lobbying
No lobbying filings found naming SEI INVESTMENTS CO as the client.
Government Contracts
No federal contract awards found for SEI INVESTMENTS CO.
U.S. Patents
No USPTO patent applications found for SEI INVESTMENTS CO.
Annual Financials
| Fiscal year | FY2025 | FY2024 | FY2023 | FY2022 | FY2021 |
|---|---|---|---|---|---|
| Revenue | $2.30B | $2.13B | $1.92B | $1.99B | $1.92B |
| Operating income | $627.3M | $551.7M | $424.5M | $475.8M | $553.4M |
| Net income | $715.3M | $581.2M | $462.3M | $475.5M | $546.6M |
| Diluted EPS | $5.63 | $4.41 | $3.46 | $3.46 | $3.81 |
| Operating cash flow | $607.7M | $622.3M | $447.0M | $566.1M | $633.1M |
| Cash and equivalents | $399.8M | $840.2M | $834.7M | $853.0M | $831.4M |
| Total assets | n/a | $2.68B | $2.52B | $2.38B | $2.35B |
| Total liabilities | n/a | $432.5M | $388.2M | $429.7M | $493.9M |
| Shareholders' equity | $2.45B | $2.25B | $2.13B | $1.95B | $1.86B |
As SEI INVESTMENTS CO tagged them in its 10-K filings: totals for the year on the income and cash-flow lines, values at the year's end on the balance-sheet lines. Latest 10-K, filed Feb 23, 2026 ↗
Stock Splits
- 2-for-1Stock splitJun 22, 2007
- 2-for-1Stock splitMar 1, 2001
- 3-for-1Stock splitJun 20, 2000
- 2-for-1Stock splitJul 7, 1993
Split dates and ratios from the price history · Close Prices from Tiingo.com