


Relay Therapeutics, Inc.
 United States·USD
Congressional Trades
| Politician | Stock | Type | Filed | Traded | |
|---|---|---|---|---|---|
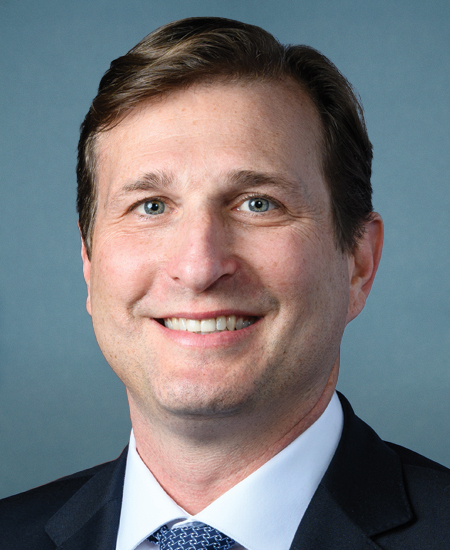 Daniel S. GoldmanHouse · D · NY |
RLAYRelay Therapeutics, Inc. · Stock |
Sale $1,001 - $15,000 |
Aug 13, 2023 | Jul 12, 2023 | Filing ↗ |
Whale Activity
- Increased95
- New30
- Held45
- Decreased80
- Closed30
- No prior filing10
| Filer | Shares | Value | Change |
|---|---|---|---|
| FMR LLC | 24.2M | $437.5M | increased |
| SB INVESTMENT ADVISERS (UK) LTD | 21.9M | $395.4M | decreased |
| T. Rowe Price Investment Management, Inc. | 17.9M | $322.5M | increased |
| BlackRock, Inc. | 16.7M | $301.4M | increased |
| Casdin Capital, LLC | 16.0M | $289.4M | held |
| PERCEPTIVE ADVISORS LLC | 12.7M | $229.8M | decreased |
| Commodore Capital LP | 12.0M | $216.6M | held |
| STATE STREET CORP | 9.2M | $165.2M | decreased |
| VANGUARD CAPITAL MANAGEMENT LLC | 9.0M | $162.7M | increased |
| Nextech Invest Ltd. | 6.8M | $122.3M | held |
| PRICE T ROWE ASSOCIATES INC /MD/ | 6.6M | $119.7M | decreased |
| Bellevue Group AG | 6.2M | $111.7M | held |
Every 13F filer's complete reported book, every quarter since 2013-06-30. 13F itself excludes short positions, cash and most options.
Insider Trading
Recent Insider Transactions
| Insider | Type | Shares | Price | Value | Date | |
|---|---|---|---|---|---|---|
| Patel SanjivPresident and CEO · Director | Sale | −48.2K | $16.13 | $777K | Nov 19, 2026 | Form 4 ↗ |
| Bergstrom Donald APresident, R&D | Sale | −10.3K | $16.51 | $170K | Nov 18, 2026 | Form 4 ↗ |
| Catinazzo ThomasChief Financial Officer | Sale | −32.7K | $16.51 | $540K | Nov 18, 2026 | Form 4 ↗ |
| Rahmer PeterSee remarks | Sale | −753 | $18.62 | $14K | Oct 28, 2026 | Form 4 ↗ |
| Bergstrom Donald APresident, R&D | Sale | −2,252 | $18.62 | $42K | Oct 28, 2026 | Form 4 ↗ |
| Catinazzo ThomasChief Financial Officer | Sale | −1,469 | $18.62 | $27K | Oct 28, 2026 | Form 4 ↗ |
| Patel SanjivPresident and CEO · Director | Sale | −48.2K | $18.10 | $872K | Oct 7, 2026 | Form 4 ↗ |
| Catinazzo ThomasChief Financial Officer | Sale | −206 | $19.26 | $4K | Oct 6, 2026 | Form 4 ↗ |
| Catinazzo ThomasChief Financial Officer | Sale | −17.5K | $18.58 | $325K | Oct 6, 2026 | Form 4 ↗ |
| Bergstrom Donald APresident, R&D | Sale | −8,530 | $18.97 | $162K | Sep 8, 2026 | Form 4 ↗ |
| Catinazzo ThomasChief Financial Officer | Sale | −17.7K | $18.94 | $336K | Sep 8, 2026 | Form 4 ↗ |
| Patel SanjivPresident and CEO · Director | Sale | −48.2K | $18.94 | $913K | Sep 8, 2026 | Form 4 ↗ |
| Rahmer PeterSee remarks | Sale | −4,508 | $20.03 | $90K | Aug 26, 2026 | Form 4 ↗ |
| SB INVESTMENT ADVISERS (UK) LTD10% owner | Sale | −6.0M | $19.40 | $116.4M | Aug 25, 2026 | Form 4 ↗ |
| Patel SanjivPresident and CEO · Director | Sale | −48.2K | $20.33 | $980K | Aug 17, 2026 | Form 4 ↗ |
| Catinazzo ThomasChief Financial Officer | Sale | −17.7K | $19.74 | $350K | Aug 14, 2026 | Form 4 ↗ |
| Catinazzo ThomasChief Financial Officer | Sale | −1,459 | $18.61 | $27K | Jul 28, 2026 | Form 4 ↗ |
| Rahmer PeterSee remarks | Sale | −748 | $18.61 | $14K | Jul 28, 2026 | Form 4 ↗ |
| Bergstrom Donald APresident, R&D | Sale | −2,237 | $18.61 | $42K | Jul 28, 2026 | Form 4 ↗ |
| Patel SanjivPresident and CEO · Director | Sale | −48.2K | $19.58 | $944K | Jul 7, 2026 | Form 4 ↗ |
Fund Holders
| Fund | Shares | Value | % of fund | As of |
|---|---|---|---|---|
| VANGUARD TOTAL STOCK MARKET INDEX FUND VANGUARD INDEX FUNDS | 6.8M | $127.2M | 0.01% | Jun 30, 2026 |
| State Street(R) SPDR(R) S&P(R) Biotech ETF SPDR SERIES TRUST | 6.3M | $118.0M | 1.10% | Jun 30, 2026 |
| iShares Russell 2000 ETF iShares Trust | 4.2M | $77.9M | 0.09% | Jun 30, 2026 |
| Select Health Care Portfolio Fidelity Select Portfolios | 2.1M | $38.2M | 0.57% | Aug 31, 2026 |
| VANGUARD EXTENDED MARKET INDEX FUND VANGUARD INDEX FUNDS | 1.9M | $36.4M | 0.04% | Jun 30, 2026 |
| Fidelity Small Cap Growth Fund Fidelity Securities Fund | 1.9M | $36.1M | 0.41% | Jul 31, 2026 |
| Strategic Advisers Fidelity U.S. Total Stock Fund Fidelity Rutland Square Trust II | 1.9M | $35.7M | 0.01% | Aug 31, 2026 |
| Fidelity Advisor Biotechnology Fund Fidelity Advisor Series VII | 1.9M | $34.8M | 1.58% | Jul 31, 2026 |
| T. Rowe Price Health Sciences Fund, Inc. | 1.8M | $34.4M | 0.29% | Jun 30, 2026 |
| Fidelity Small Cap Index Fund Fidelity Salem Street Trust | 1.8M | $33.3M | 0.10% | Jul 31, 2026 |
Mutual funds and ETFs whose N-PORT filings list RLAY's shares (CUSIP 75943R102), each fund at its latest report since Apr 21, 2026, largest positions first. Bonds, options and short positions are left out.
Activist & Passive Stakes
- T. Rowe Price Investment Management, Inc.SCHEDULE 13G · passive (13G) · 17.9M shares8.2%
Nov 16, 2026 · ↗ - SVF Pauling (Cayman) LtdSCHEDULE 13G/A · passive (13G) · 21.9M shares9.9%
Nov 16, 2026 · ↗ - SoftBank Vision Fund (AIV M2) L.P.SCHEDULE 13G/A · passive (13G) · 21.9M shares9.9%
Nov 16, 2026 · ↗ - SB Investment Advisers (UK) LimitedSCHEDULE 13G/A · passive (13G) · 21.9M shares9.9%
Nov 16, 2026 · ↗ - Michael KramarzSCHEDULE 13G/A · passive (13G) · 12.0M shares5.5%
Aug 14, 2026 · ↗ - Robert Egen AtkinsonSCHEDULE 13G/A · passive (13G) · 12.0M shares5.5%
Aug 14, 2026 · ↗ - Commodore Capital Master LPSCHEDULE 13G/A · passive (13G) · 12.0M shares5.5%
Aug 14, 2026 · ↗ - Commodore Capital LPSCHEDULE 13G/A · passive (13G) · 12.0M shares5.5%
Aug 14, 2026 · ↗ - Perceptive Life Sciences Master Fund, Ltd.SCHEDULE 13G/A · passive (13G) · 14.1M shares6.4%
Aug 10, 2026 · ↗ - Joseph EdelmanSCHEDULE 13G/A · passive (13G) · 14.1M shares6.4%
Aug 10, 2026 · ↗
Corporate Lobbying
No lobbying filings found naming Relay Therapeutics, Inc. as the client.
Government Contracts
No federal contract awards found for Relay Therapeutics, Inc..
U.S. Patents
No USPTO patent applications found for Relay Therapeutics, Inc..
Annual Financials
| Fiscal year | FY2025 | FY2024 | FY2023 | FY2022 | FY2021 |
|---|---|---|---|---|---|
| Revenue | $15.4M | $10.0M | $25.5M | $1.4M | $3.0M |
| Operating income | -$302.7M | -$372.5M | -$373.0M | -$299.3M | -$364.7M |
| Net income | -$276.5M | -$337.7M | -$342.0M | -$290.5M | -$363.9M |
| Diluted EPS | -$1.61 | -$2.36 | -$2.79 | -$2.59 | -$3.82 |
| Operating cash flow | -$235.5M | -$249.1M | -$300.3M | -$229.5M | -$74.4M |
| Cash and equivalents | $84.0M | $124.3M | $143.7M | $151.8M | $280.1M |
| Total assets | $621.3M | $871.3M | $844.0M | $1.10B | $1.01B |
| Total liabilities | $54.3M | $93.5M | $92.0M | $149.6M | $110.6M |
| Shareholders' equity | $567.1M | $777.8M | $752.0M | $950.2M | $897.8M |
As Relay Therapeutics, Inc. tagged them in its 10-K filings: totals for the year on the income and cash-flow lines, values at the year's end on the balance-sheet lines. Latest 10-K, filed Feb 26, 2026 ↗
Stock Splits
No stock splits in RLAY's price history.
Material Events (8-K)
- 8-K · Items 2.02, 9.01Results of operationsNov 4, 2026
EDGAR ↗ - 8-K · Items 1.01, 2.02, 9.01Material agreement · Results of operationsAug 6, 2026
EDGAR ↗ - 8-K · Items 5.03, 5.07, 9.01Bylaw amendment · Shareholder voteJun 9, 2026
EDGAR ↗ - 8-K · Items 1.01, 9.01Material agreementMay 21, 2026
EDGAR ↗ - 8-K · Items 7.01, 8.01, 9.01Reg FD disclosure · Other eventsMay 19, 2026
EDGAR ↗ - 8-K · Items 2.02, 9.01Results of operationsMay 5, 2026
EDGAR ↗