


PTC INC.
 United States·USD
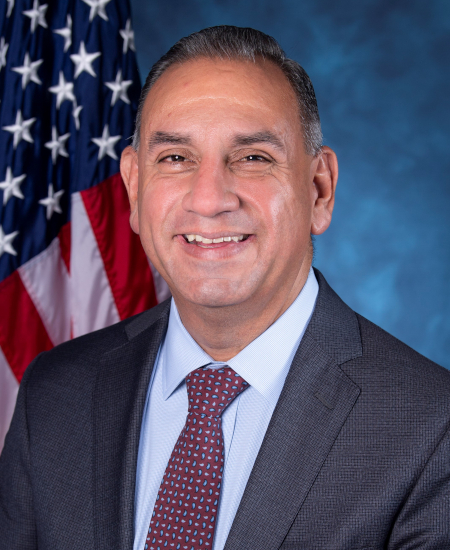
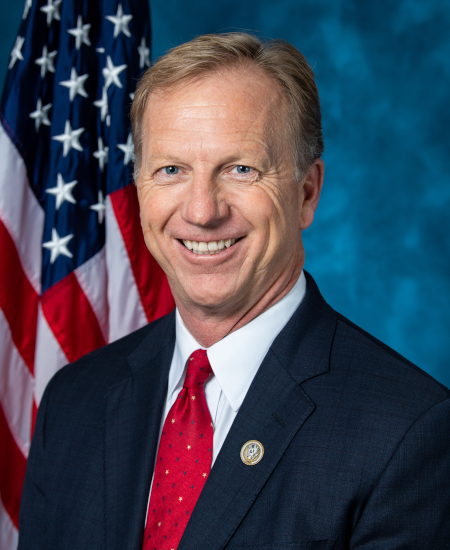
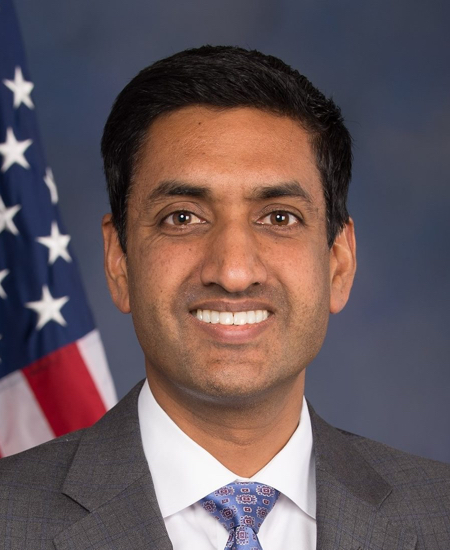
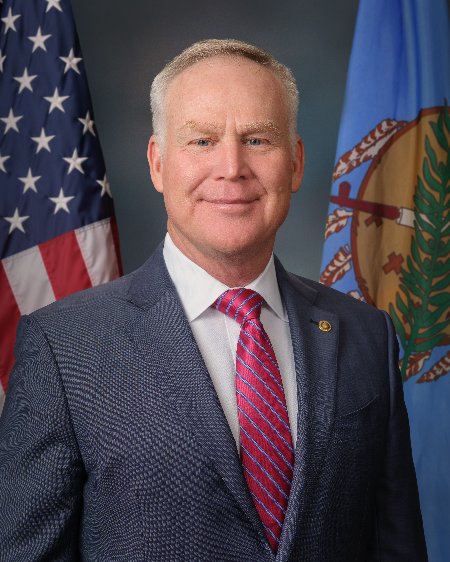
Congressional Trades

Whale Activity
- Increased250
- New92
- Held76
- Decreased242
- Closed80
- No prior filing30
| Filer | Shares | Value | Change |
|---|---|---|---|
| BlackRock, Inc. | 10.5M | $1.48B | decreased |
| T. Rowe Price Investment Management, Inc. | 9.4M | $1.32B | decreased |
| VANGUARD CAPITAL MANAGEMENT LLC | 7.1M | $996.3M | decreased |
| STATE STREET CORP | 6.1M | $853.0M | decreased |
| VANGUARD PORTFOLIO MANAGEMENT LLC | 5.2M | $733.7M | decreased |
| GEODE CAPITAL MANAGEMENT, LLC | 3.5M | $485.3M | decreased |
| CITADEL ADVISORS LLC | 2.9M | $408.7M | increased |
| Invesco Ltd. | 2.9M | $406.5M | increased |
| Pictet Asset Management Holding SA | 2.9M | $406.3M | decreased |
| Janus Henderson Group Ltd. | 2.2M | $308.0M | — |
| Standard Investments LLC | 1.8M | $254.3M | held |
| DnB Asset Management AS | 1.8M | $245.9M | increased |
Every 13F filer's complete reported book, every quarter since 2013-06-30. 13F itself excludes short positions, cash and most options.
Insider Trading
Recent Insider Transactions
| Insider | Type | Shares | Price | Value | Date | |
|---|---|---|---|---|---|---|
| Lathan CorinnaDirector · Director | Sale | −1,750 | $195.75 | $343K | Oct 5, 2026 | Form 4 ↗ |
| BERNSHTEYN ROBERTDirector | Option exercise | +1,117 | $0.00 | $0 | Sep 15, 2026 | Form 4 ↗ |
| Barua NeilPresident and CEO · Director | Tax withholding | −5,547 | $149.75 | $831K | Aug 15, 2026 | Form 4 ↗ |
| Barua NeilPresident and CEO · Director | Option exercise | +11.5K | $0.00 | $0 | Aug 15, 2026 | Form 4 ↗ |
| STEVENSON JONChief Product Officer | Tax withholding | −1,204 | $149.75 | $180K | Aug 15, 2026 | Form 4 ↗ |
| STEVENSON JONChief Product Officer | Option exercise | +4,099 | $0.00 | $0 | Aug 15, 2026 | Form 4 ↗ |
| CHRISTENSON ALICEChief Accounting Officer | Sale | −816 | $145.83 | $119K | May 12, 2026 | Form 4 ↗ |
| CHRISTENSON ALICEChief Accounting Officer | Tax withholding | −370 | $147.65 | $55K | May 7, 2026 | Form 4 ↗ |
| CHRISTENSON ALICEChief Accounting Officer | Grant / award | +1,186 | $0.00 | $0 | May 7, 2026 | Form 4 ↗ |
| Lathan CorinnaDirector | Sale | −675 | $157.24 | $106K | Mar 16, 2026 | Form 4 ↗ |
| Pham TracDirector | Option exercise | +1,181 | $0.00 | $0 | Mar 15, 2026 | Form 4 ↗ |
| VON STAATS AARON CEVP, Chief Legal Officer | Sale | −2,639 | $160.00 | $422K | Mar 3, 2026 | Form 4 ↗ |
| Katz MichalDirector | Option exercise | +1,500 | $0.00 | $0 | Feb 11, 2026 | Form 4 ↗ |
| Lathan CorinnaDirector | Option exercise | +1,500 | $0.00 | $0 | Feb 11, 2026 | Form 4 ↗ |
| Pham TracDirector | Option exercise | +1,431 | $0.00 | $0 | Feb 11, 2026 | Form 4 ↗ |
| Benjamin Mark DDirector | Option exercise | +1,500 | $0.00 | $0 | Feb 11, 2026 | Form 4 ↗ |
| BERNSHTEYN ROBERTDirector | Option exercise | +1,500 | $0.00 | $0 | Feb 11, 2026 | Form 4 ↗ |
| Hanspal AmarpreetDirector | Option exercise | +1,500 | $0.00 | $0 | Feb 11, 2026 | Form 4 ↗ |
| VON STAATS AARON CEVP, Chief Legal Officer | Sale | −8 | $162.23 | $1K | Feb 11, 2026 | Form 4 ↗ |
| VON STAATS AARON CEVP, Chief Legal Officer | Sale | −232 | $161.06 | $37K | Feb 11, 2026 | Form 4 ↗ |
Fund Holders
| Fund | Shares | Value | % of fund | As of |
|---|---|---|---|---|
| T. Rowe Price Capital Appreciation Fund T. ROWE PRICE CAPITAL APPRECIATION FUND, INC. | 4.2M | $476.5M | 0.68% | Jun 30, 2026 |
| VANGUARD TOTAL STOCK MARKET INDEX FUND VANGUARD INDEX FUNDS | 3.7M | $416.5M | 0.02% | Jun 30, 2026 |
| VANGUARD 500 INDEX FUND VANGUARD INDEX FUNDS | 3.0M | $339.8M | 0.02% | Jun 30, 2026 |
| T. Rowe Price Mid-Cap Growth Fund, Inc. | 2.8M | $313.3M | 1.36% | Jun 30, 2026 |
| VANGUARD SMALL-CAP INDEX FUND VANGUARD INDEX FUNDS | 2.6M | $300.8M | 0.16% | Jun 30, 2026 |
| Janus Henderson Enterprise Fund Janus Investment Fund | 2.6M | $295.8M | 1.32% | Jun 30, 2026 |
| Fidelity 500 Index Fund Fidelity Concord Street Trust | 1.5M | $233.5M | 0.03% | Aug 31, 2026 |
| VANGUARD INFORMATION TECHNOLOGY INDEX FUND VANGUARD WORLD FUND | 1.3M | $202.1M | 0.12% | Aug 31, 2026 |
| Invesco S&P 500 Equal Weight ETF Invesco Exchange-Traded Fund Trust | 1.4M | $189.2M | 0.20% | Jul 31, 2026 |
| iShares Core S&P 500 ETF iShares Trust | 1.6M | $180.5M | 0.02% | Jun 30, 2026 |
Mutual funds and ETFs whose N-PORT filings list PTC's shares (CUSIP 69370C100), each fund at its latest report since Apr 21, 2026, largest positions first. Bonds, options and short positions are left out.
Activist & Passive Stakes
- T. Rowe Price Investment Management, Inc.SCHEDULE 13G/A · passive (13G) · 9.4M shares8.6%
Nov 16, 2026 · ↗ - T. Rowe Price Investment Management, Inc.SCHEDULE 13G/A · passive (13G) · 13.1M shares11.3%
Aug 14, 2026 · ↗ - STATE STREET CORPORATIONSCHEDULE 13G · passive (13G) · 6.5M shares5.6%
Aug 7, 2026 · ↗ - T. Rowe Price Investment Management, Inc.SCHEDULE 13G/A · passive (13G) · 19.1M shares16.0%
May 15, 2026 · ↗
Corporate Lobbying
Government Contracts
- Department of DefenseSOFTWARE LICENSEE$20K
Jun 29, 2021 · ↗ - Department of DefensePTC APEXADA$12K
Aug 30, 2019 · ↗ - National Aeronautics and Space AdministrationFY26 PTC INC. (PTC) SOFTWARE AND TSAM RENEWAL$7.3M
Mar 15, 2026 · ↗ - Department of TransportationPURCHASE OF EIGHT (8) ANNUAL LINUX TELEUSE LICENSE RENEWALS.$43K
Jul 20, 2026 · ↗ - Department of DefenseSERVICE AND MAINTENANCE PROCUREMENT$24K
Jun 28, 2023 · ↗ - Department of Homeland SecurityDEMAND FORECASTING SOFTWARE SUBSCRIPTION$6.4M
Sep 1, 2022 · ↗
U.S. Patents
No USPTO patent applications found for PTC INC..
Annual Financials
| Fiscal year | FY2025 | FY2024 | FY2023 | FY2022 | FY2021 |
|---|---|---|---|---|---|
| Revenue | $2.74B | $2.30B | $2.10B | $1.93B | $1.81B |
| Operating income | $982.4M | $588.1M | $458.5M | $447.4M | $380.7M |
| Net income | $734.0M | $376.3M | $245.5M | $313.1M | $476.9M |
| Diluted EPS | $6.08 | $3.12 | $2.06 | $2.65 | $4.03 |
| Operating cash flow | $867.7M | $750.0M | $610.9M | $435.3M | $368.8M |
| Cash and equivalents | $184.4M | $265.8M | $288.1M | $272.2M | $326.5M |
| Total assets | $6.62B | $6.38B | $6.29B | $4.69B | $4.51B |
| Total liabilities | $2.79B | $3.17B | $3.61B | $2.39B | $2.47B |
| Shareholders' equity | $3.83B | $3.21B | $2.68B | $2.30B | $2.04B |
As PTC INC. tagged them in its 10-K filings: totals for the year on the income and cash-flow lines, values at the year's end on the balance-sheet lines. Latest 10-K, filed Nov 21, 2025 ↗
Stock Splits
- 2-for-5Reverse splitFeb 28, 2006
- 2-for-1Stock splitMar 9, 1998
- 2-for-1Stock splitMar 1, 1996
- 2-for-1Stock splitFeb 26, 1993
- 2-for-1Stock splitFeb 26, 1992
- 3-for-2Stock splitJun 28, 1991
Split dates and ratios from the price history · Close Prices from Tiingo.com
Material Events (8-K)
About PTC INC.
Our Business PTC is a global software company headquartered in Boston, Massachusetts. We employ over 7,000 people and support more than 30,000 customers globally. We primarily serve customers in the following industry verticals: • Industrials • Federal, Aerospace and Defense • Electronics and High Tech • Automotive • Medical Technology and Life Sciences Our customers are focused on improving their competitiveness in the face of global competition and increasing product complexity, and our suite of software offerings is a strategic enabler of this and their digital transformation initiatives. Given the breadth and openness of our portfolio, we enable the Intelligent Product Lifecycle: establi…