


Dave & Buster's Entertainment, Inc.
 United States·USD
Congressional Trades
| Politician | Stock | Type | Filed | Traded | |
|---|---|---|---|---|---|
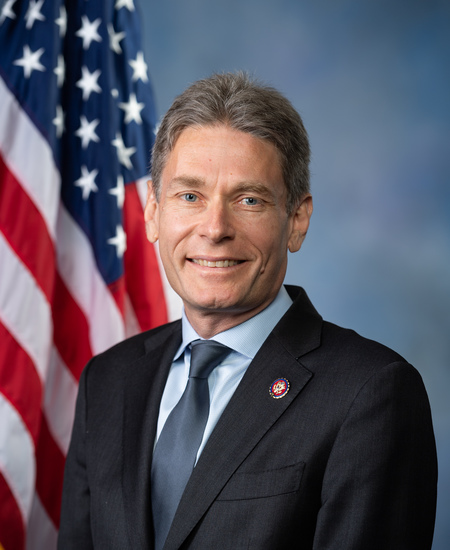 Tom MalinowskiHouse · D · NJ |
PLAYDave & Buster's Entertainment, Inc. · Stock |
Sale $1,001 - $15,000 |
Aug 26, 2021 | Apr 5, 2019 | Filing ↗ |
| Tom MalinowskiHouse · D · NJ |
PLAYDave & Buster's Entertainment, Inc. · Stock |
Sale $15,001 - $50,000 |
Jul 9, 2021 | Aug 7, 2019 | Filing ↗ |
| Tom MalinowskiHouse · D · NJ |
PLAYDave & Buster's Entertainment, Inc. · Stock |
Purchase $1,001 - $15,000 |
Jul 9, 2021 | Apr 3, 2019 | Filing ↗ |
Whale Activity
- Increased55
- New23
- Held26
- Decreased40
- Closed43
- No prior filing4
| Filer | Shares | Value | Change |
|---|---|---|---|
| Hill Path Capital LP | 7.1M | $45.4M | held |
| BlackRock, Inc. | 3.9M | $25.2M | increased |
| NOMURA HOLDINGS INC | 2.4M | $15.4M | held |
| ARROWSTREET CAPITAL, LIMITED PARTNERSHIP | 2.4M | $15.1M | increased |
| GOLDMAN SACHS GROUP INC | 1.8M | $11.4M | decreased |
| VANGUARD CAPITAL MANAGEMENT LLC | 1.2M | $7.4M | held |
| UBS Group AG | 1.1M | $6.8M | increased |
| CHARLES SCHWAB INVESTMENT MANAGEMENT INC | 953.8K | $6.1M | increased |
| MARSHALL WACE, LLP | 683.0K | $4.4M | increased |
| Jump Financial, LLC | 625.0K | $4.0M | increased |
| CastleKnight Management LP | 619.4K | $4.0M | held |
| TWO SIGMA INVESTMENTS, LP | 612.2K | $3.9M | decreased |
Every 13F filer's complete reported book, every quarter since 2013-06-30. 13F itself excludes short positions, cash and most options.
Insider Trading
Recent Insider Transactions
| Insider | Type | Shares | Price | Value | Date | |
|---|---|---|---|---|---|---|
| Hatton CoryInterim CFO | Purchase | +4,000 | $6.50 | $26K | Sep 28, 2026 | Form 4 ↗ |
| Lipman NathanielDirector | Grant / award | +10.6K | $0.00 | $0 | Sep 25, 2026 | Form 4 ↗ |
| Protell CharlesDirector | Grant / award | +10.6K | $0.00 | $0 | Sep 25, 2026 | Form 4 ↗ |
| Morgan RachelChief Legal Officer, Corp Sec | Grant / award | +15.1K | $0.00 | $0 | Sep 25, 2026 | Form 4 ↗ |
| Weiss Allen RDirector | Grant / award | +10.6K | $0.00 | $0 | Sep 25, 2026 | Form 4 ↗ |
| Lipman NathanielDirector | Purchase Amended | +12.0K | $6.78 | $81K | Sep 17, 2026 | Form 4 ↗ |
| Lipman NathanielDirector | Purchase | +12.0K | $6.78 | $81K | Sep 17, 2026 | Form 4 ↗ |
| Busby AmandaChief Operations Officer | Grant / award | +72.5K | $0.00 | $0 | Aug 31, 2026 | Form 4 ↗ |
| Sample DerekChief Accounting Officer | Grant / award | +39.0K | $0.00 | $0 | Aug 31, 2026 | Form 4 ↗ |
| Protell CharlesDirector | Grant / award | +11.2K | $0.00 | $0 | Aug 18, 2026 | Form 4 ↗ |
| Hatton CoryInterim CFO | Grant / award Amended | +50.8K | $0.00 | $0 | Aug 10, 2026 | Form 4 ↗ |
| Rosales AldoChief Strategy & Revenue Ofc | Grant / award | +50.8K | $0.00 | $0 | Aug 10, 2026 | Form 4 ↗ |
| Hatton CoryInterim CFO | Grant / award | +50.8K | $0.00 | $0 | Aug 10, 2026 | Form 4 ↗ |
| Harper DarinChief Executive Officer | Grant / award | +203.0K | $0.00 | $0 | Aug 10, 2026 | Form 4 ↗ |
| SHEEHAN KEVIN MDirector | Grant / award | +35.5K | $0.00 | $0 | Aug 10, 2026 | Form 4 ↗ |
| HP G GP LLC | Grant / award | +952 | $0.00 | $0 | Aug 5, 2026 | Form 4 ↗ |
| Hill Path Capital Partners II LP | Grant / award | +952 | $0.00 | $0 | Aug 5, 2026 | Form 4 ↗ |
| CHAMBERS JAMES P.Director | Grant / award | +1,071 | $0.00 | $0 | Aug 5, 2026 | Form 4 ↗ |
| Protell CharlesDirector | Grant / award | +784 | $0.00 | $0 | Aug 5, 2026 | Form 4 ↗ |
| SHEEHAN KEVIN MDirector | Grant / award | +1,309 | $0.00 | $0 | Aug 5, 2026 | Form 4 ↗ |
Fund Holders
| Fund | Shares | Value | % of fund | As of |
|---|---|---|---|---|
| VANGUARD TOTAL STOCK MARKET INDEX FUND VANGUARD INDEX FUNDS | 818.5K | $9.3M | 0.00% | Jun 30, 2026 |
| iShares Russell 2000 ETF iShares Trust | 709.6K | $8.1M | 0.01% | Jun 30, 2026 |
| BlackRock Advantage Small Cap Core Fund BlackRock Funds | 458.7K | $4.1M | 0.07% | Aug 31, 2026 |
| Schwab Fundamental U.S. Small Company ETF SCHWAB STRATEGIC TRUST | 440.1K | $3.9M | 0.04% | Aug 31, 2026 |
| VANGUARD EXTENDED MARKET INDEX FUND VANGUARD INDEX FUNDS | 317.0K | $3.6M | 0.00% | Jun 30, 2026 |
| Fidelity Small Cap Index Fund Fidelity Salem Street Trust | 296.9K | $3.2M | 0.01% | Jul 31, 2026 |
| iShares Russell 2000 Growth ETF iShares Trust | 255.9K | $2.9M | 0.02% | Jun 30, 2026 |
| Invesco RAFI US 1500 Small-Mid ETF Invesco Exchange-Traded Fund Trust | 160.9K | $1.7M | 0.06% | Jul 31, 2026 |
| VANGUARD RUSSELL 2000 INDEX FUND VANGUARD SCOTTSDALE FUNDS | 156.5K | $1.4M | 0.01% | Aug 31, 2026 |
| Fidelity Extended Market Index Fund Fidelity Concord Street Trust | 152.8K | $1.4M | 0.00% | Aug 31, 2026 |
Mutual funds and ETFs whose N-PORT filings list PLAY's shares (CUSIP 238337109), each fund at its latest report since Apr 22, 2026, largest positions first. Bonds, options and short positions are left out.
Activist & Passive Stakes
- Arrowstreet Capital Holding LLCSCHEDULE 13G/A · passive (13G) · 2.4M shares6.8%
Nov 13, 2026 · ↗ - Arrowstreet Capital, Limited PartnershipSCHEDULE 13G/A · passive (13G) · 2.4M shares6.8%
Nov 13, 2026 · ↗ - GOLDMAN SACHS & CO. LLCSCHEDULE 13G/A · passive (13G) · 1.8M shares5.1%
Nov 10, 2026 · ↗ - THE GOLDMAN SACHS GROUP, INC.SCHEDULE 13G/A · passive (13G) · 1.8M shares5.1%
Nov 10, 2026 · ↗ - BlackRock Portfolio Management LLCSCHEDULE 13G · passive (13G) · 1.8M shares5.3%
Oct 27, 2026 · ↗ - Arrowstreet Capital Holding LLCSCHEDULE 13G · passive (13G) · 1.8M shares5.2%
Aug 13, 2026 · ↗ - Arrowstreet Capital, Limited PartnershipSCHEDULE 13G · passive (13G) · 1.8M shares5.2%
Aug 13, 2026 · ↗ - GOLDMAN SACHS & CO. LLCSCHEDULE 13G · passive (13G) · 2.3M shares6.5%
Aug 13, 2026 · ↗ - THE GOLDMAN SACHS GROUP, INC.SCHEDULE 13G · passive (13G) · 2.3M shares6.5%
Aug 13, 2026 · ↗ - Ricky C. SandlerSCHEDULE 13G/A · passive (13G) · 0 shares0.0%
Jul 2, 2026 · ↗
Corporate Lobbying
No lobbying filings found naming Dave & Buster's Entertainment, Inc. as the client.
Government Contracts
No federal contract awards found for Dave & Buster's Entertainment, Inc..
U.S. Patents
No USPTO patent applications found for Dave & Buster's Entertainment, Inc..
Annual Financials
| Fiscal year | FY2026 | FY2025 | FY2024 | FY2023 | FY2022 |
|---|---|---|---|---|---|
| Revenue | $2.10B | $2.13B | $2.21B | $1.96B | $1.30B |
| Operating income | $86.1M | $220.4M | $306.6M | $262.5M | $187.2M |
| Net income | -$48.7M | $58.3M | $126.9M | n/a | n/a |
| Diluted EPS | -$1.40 | $1.46 | $2.88 | $2.79 | $2.21 |
| Operating cash flow | $290.8M | $312.3M | $364.2M | $444.4M | $283.2M |
| Cash and equivalents | $16.6M | $6.9M | $37.3M | $181.6M | $25.9M |
| Total assets | $4.12B | $4.02B | $3.75B | $3.76B | $2.35B |
| Shareholders' equity | $91.2M | $145.8M | $251.2M | $410.5M | $275.4M |
As Dave & Buster's Entertainment, Inc. tagged them in its 10-K filings: totals for the year on the income and cash-flow lines, values at the year's end on the balance-sheet lines. Latest 10-K, filed Mar 31, 2026 ↗
Stock Splits
No stock splits in PLAY's price history.
Material Events (8-K)
- 8-K · Items 5.02, 8.01, 9.01Officer / director change · Other eventsSep 21, 2026
EDGAR ↗ - 8-K · Items 2.02, 9.01Results of operationsSep 14, 2026
EDGAR ↗ - 8-K · Items 5.02, 9.01Officer / director changeAug 4, 2026
EDGAR ↗ - 8-K · Items 5.07, 9.01Shareholder voteJun 25, 2026
EDGAR ↗ - 8-K · Items 2.02, 9.01Results of operationsJun 15, 2026
EDGAR ↗ - 8-K · Items 5.02, 7.01, 9.01Officer / director change · Reg FD disclosureMay 1, 2026
EDGAR ↗