


OMNICOM GROUP INC.
 United States·USD
Congressional Trades
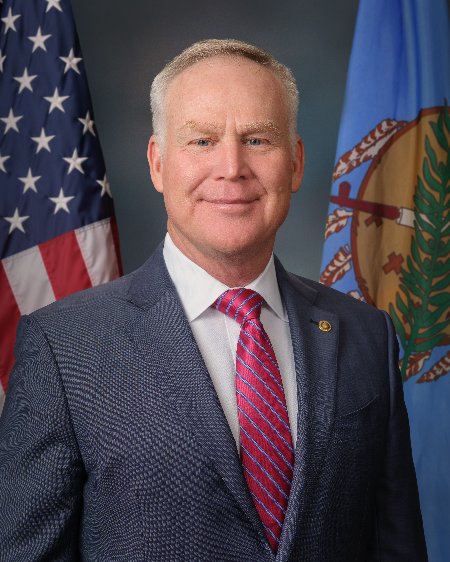
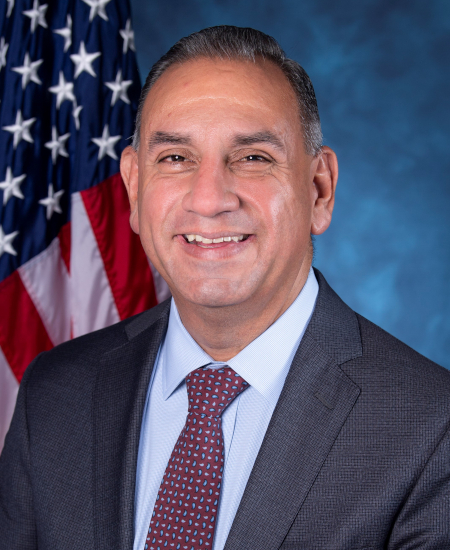
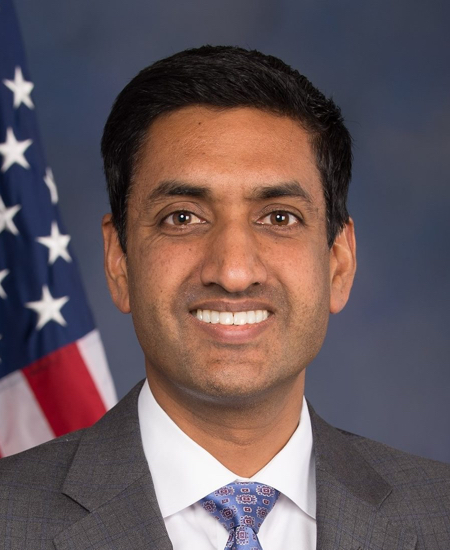
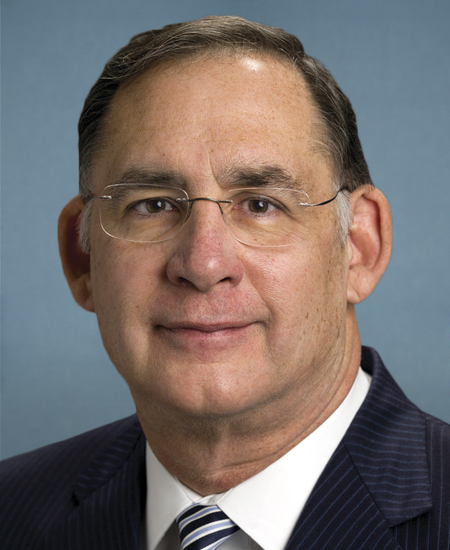
Whale Activity
- Increased353
- New87
- Held166
- Decreased441
- Closed83
- No prior filing48
| Filer | Shares | Value | Change |
|---|---|---|---|
| BlackRock, Inc. | 28.4M | $2.09B | decreased |
| STATE STREET CORP | 20.3M | $1.52B | decreased |
| VANGUARD CAPITAL MANAGEMENT LLC | 17.9M | $1.32B | decreased |
| VANGUARD PORTFOLIO MANAGEMENT LLC | 13.0M | $958.4M | decreased |
| Bank of New York Mellon Corp | 10.7M | $784.4M | decreased |
| JPMORGAN CHASE & CO | 10.5M | $777.1M | decreased |
| FMR LLC | 9.8M | $719.2M | increased |
| GEODE CAPITAL MANAGEMENT, LLC | 8.3M | $606.4M | decreased |
| HOTCHKIS & WILEY CAPITAL MANAGEMENT LLC | 8.1M | $594.7M | increased |
| MASSACHUSETTS FINANCIAL SERVICES CO /MA/ | 7.4M | $553.1M | decreased |
| First Eagle Investment Management, LLC | 7.4M | $544.6M | increased |
| Capital Research Global Investors | 6.7M | $496.5M | increased |
Every 13F filer's complete reported book, every quarter since 2013-06-30. 13F itself excludes short positions, cash and most options.
Insider Trading
Recent Insider Transactions
| Insider | Type | Shares | Price | Value | Date | |
|---|---|---|---|---|---|---|
| RICE LINDA JOHNSONDirector · Director | Sale | −697 | $87.92 | $61K | Nov 12, 2026 | Form 4 ↗ |
| RICE LINDA JOHNSONDirector | Sale | −1,385 | $88.73 | $123K | Aug 24, 2026 | Form 4 ↗ |
| Simm DarylCo-President and Co-COO | Tax withholding | −3,172 | $87.57 | $278K | Aug 15, 2026 | Form 4 ↗ |
| Januzzi Louis FSenior VP, Gen. Counsel & Sec. | Tax withholding | −1,308 | $87.57 | $115K | Aug 15, 2026 | Form 4 ↗ |
| Castellaneta AndrewSVP, Chief Accounting Officer | Tax withholding | −1,348 | $87.57 | $118K | Aug 15, 2026 | Form 4 ↗ |
| Januzzi Louis FSenior VP, Gen. Counsel & Sec. | Grant / award | +7,720 | $0.00 | $0 | Jul 16, 2026 | Form 4 ↗ |
| Moore Patrick QDirector | Grant / award | +704 | $0.00 | $0 | Jul 1, 2026 | Form 4 ↗ |
| Santos CassandraDirector | Grant / award | +704 | $0.00 | $0 | Jul 1, 2026 | Form 4 ↗ |
| WYATT E LEEDirector | Grant / award | +704 | $0.00 | $0 | Jul 1, 2026 | Form 4 ↗ |
| Gerstein Mark DDirector | Grant / award | +309 | $0.00 | $0 | Jul 1, 2026 | Form 4 ↗ |
| Gerstein Mark DDirector | Grant / award | +704 | $0.00 | $0 | Jul 1, 2026 | Form 4 ↗ |
| COLEMAN LEONARD S JRDirector | Grant / award | +704 | $0.00 | $0 | Jul 1, 2026 | Form 4 ↗ |
| MARTORE GRACIA CDirector | Grant / award | +704 | $0.00 | $0 | Jul 1, 2026 | Form 4 ↗ |
| Hawkins Ronnie S.Director | Grant / award | +704 | $0.00 | $0 | Jul 1, 2026 | Form 4 ↗ |
| Williams ValerieDirector | Grant / award | +704 | $0.00 | $0 | Jul 1, 2026 | Form 4 ↗ |
| Pineda Patricia SalasDirector | Grant / award | +704 | $0.00 | $0 | Jul 1, 2026 | Form 4 ↗ |
| Kissire Deborah J.Director | Grant / award | +704 | $0.00 | $0 | Jul 1, 2026 | Form 4 ↗ |
| RICE LINDA JOHNSONDirector | Grant / award | +704 | $0.00 | $0 | Jul 1, 2026 | Form 4 ↗ |
| CHOKSI MARY CDirector | Grant / award | +704 | $0.00 | $0 | Jul 1, 2026 | Form 4 ↗ |
| WREN JOHNChairman and CEO · Director | Tax withholding | −38.8K | $74.93 | $2.9M | May 22, 2026 | Form 4 ↗ |
Fund Holders
| Fund | Shares | Value | % of fund | As of |
|---|---|---|---|---|
| VANGUARD TOTAL STOCK MARKET INDEX FUND VANGUARD INDEX FUNDS | 9.1M | $659.1M | 0.03% | Jun 30, 2026 |
| State Street(R) Communication Services Select Sector SPDR(R) ETF SELECT SECTOR SPDR TRUST | 7.7M | $557.3M | 2.50% | Jun 30, 2026 |
| VANGUARD 500 INDEX FUND VANGUARD INDEX FUNDS | 7.4M | $537.1M | 0.03% | Jun 30, 2026 |
| VANGUARD SMALL-CAP INDEX FUND VANGUARD INDEX FUNDS | 6.5M | $476.0M | 0.25% | Jun 30, 2026 |
| First Eagle Global Fund First Eagle Funds | 5.2M | $405.8M | 0.53% | Jul 31, 2026 |
| Fidelity 500 Index Fund Fidelity Concord Street Trust | 3.7M | $323.8M | 0.04% | Aug 31, 2026 |
| VANGUARD WINDSOR II FUND VANGUARD WINDSOR FUNDS | 4.1M | $320.8M | 0.48% | Jul 31, 2026 |
| Strategic Advisers Fidelity U.S. Total Stock Fund Fidelity Rutland Square Trust II | 3.5M | $303.7M | 0.11% | Aug 31, 2026 |
| VANGUARD SMALL-CAP VALUE INDEX FUND VANGUARD INDEX FUNDS | 4.1M | $301.6M | 0.44% | Jun 30, 2026 |
| iShares Core S&P 500 ETF iShares Trust | 3.9M | $285.6M | 0.03% | Jun 30, 2026 |
Mutual funds and ETFs whose N-PORT filings list OMC's shares (CUSIP 681919106), each fund at its latest report since Apr 21, 2026, largest positions first. Bonds, options and short positions are left out.
Activist & Passive Stakes
- STATE STREET CORPORATIONSCHEDULE 13G · passive (13G) · 20.4M shares7.4%
Nov 10, 2026 · ↗ - SSGA FUNDS MANAGEMENT, INC.SCHEDULE 13G · passive (13G) · 14.5M shares5.1%
Aug 7, 2026 · ↗ - STATE STREET CORPORATIONSCHEDULE 13G · passive (13G) · 24.6M shares8.6%
Aug 7, 2026 · ↗ - Vanguard Portfolio ManagementSCHEDULE 13G/A · passive (13G) · 13.5M shares4.7%
Jul 31, 2026 · ↗ - SSGA FUNDS MANAGEMENT, INC.SCHEDULE 13G · passive (13G) · 16.7M shares5.9%
May 12, 2026 · ↗ - STATE STREET CORPORATIONSCHEDULE 13G · passive (13G) · 27.8M shares9.7%
May 12, 2026 · ↗ - Vanguard Capital ManagementSCHEDULE 13G · passive (13G) · 23.5M shares8.2%
Apr 30, 2026 · ↗
Corporate Lobbying
No lobbying filings found naming OMNICOM GROUP INC. as the client.
Government Contracts
No federal contract awards found for OMNICOM GROUP INC..
U.S. Patents
No USPTO patent applications found for OMNICOM GROUP INC..
Annual Financials
| Fiscal year | FY2025 | FY2024 | FY2023 | FY2022 | FY2021 |
|---|---|---|---|---|---|
| Revenue | $17.27B | $15.69B | $14.69B | $14.29B | $14.29B |
| Operating income | $444.7M | $2.27B | $2.10B | $2.08B | $2.20B |
| Net income | -$54.5M | $1.48B | $1.39B | $1.32B | $1.41B |
| Diluted EPS | -$0.27 | $7.46 | $6.91 | $6.36 | $6.53 |
| Operating cash flow | $2.94B | $1.73B | $1.42B | $926.5M | $1.95B |
| Cash and equivalents | n/a | n/a | n/a | n/a | $5.32B |
| Total assets | $54.42B | $29.62B | $28.04B | $27.00B | $28.42B |
| Shareholders' equity | $12.05B | $4.19B | $3.62B | $3.25B | $3.27B |
As OMNICOM GROUP INC. tagged them in its 10-K filings: totals for the year on the income and cash-flow lines, values at the year's end on the balance-sheet lines. Latest 10-K, filed Feb 20, 2026 ↗
Stock Splits
- 2-for-1Stock splitJun 26, 2007
- 2-for-1Stock splitDec 30, 1997
- 2-for-1Stock splitDec 28, 1995
Split dates and ratios from the price history · Close Prices from Tiingo.com