

Stocks › NPO

Enpro Inc.
NPO·NYSE· United States·USD
$252.87
-10.94 (-4.15%)
Close · Nov 20, 2026 · Close Prices from Tiingo.com
NPO
Enpro Inc. · NYSE
Nasdaq 100S&P 500
Filings
Default90D1Y5YALL
NPOS&P 500 (rebased)
Congress BuyCongress SellInsider BuyInsider SellForm 1448-K ResultsLobbying
Loading price history…
Daily closes, adjusted for splits and dividends · Close Prices from Tiingo.comHover a marker, every one is a filing · move across the line for the crosshair
Congressional Trades
Recent trades of NPO by members of U.S. Congress · 1 on record
| Politician | Stock | Type | Filed | Traded | |
|---|---|---|---|---|---|
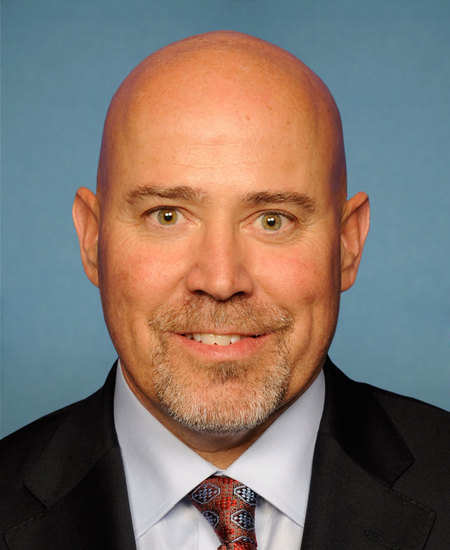 Thomas MacArthurHouse · R · NJ |
NPOEnpro Inc. · Stock |
Sale $1,001 - $15,000 |
Mar 3, 2016 | Feb 1, 2016 | Filing ↗ |
Whale Activity
Position changes in NPO reported for 2026-09-30 by 457 institutional filers
- Increased134
- New49
- Held70
- Decreased139
- Closed42
- No prior filing23
| Filer | Shares | Value | Change |
|---|---|---|---|
| BlackRock, Inc. | 3.5M | $1.07B | increased |
| VANGUARD PORTFOLIO MANAGEMENT LLC | 1.5M | $465.0M | increased |
| FMR LLC | 1.2M | $367.6M | decreased |
| Invesco Ltd. | 1.0M | $307.1M | increased |
| VANGUARD CAPITAL MANAGEMENT LLC | 950.8K | $291.2M | increased |
| STATE STREET CORP | 855.4K | $262.0M | increased |
| GEODE CAPITAL MANAGEMENT, LLC | 607.6K | $186.1M | increased |
| Capital International Investors | 554.3K | $169.7M | decreased |
| DIMENSIONAL FUND ADVISORS LP | 553.0K | $169.4M | decreased |
| PRICE T ROWE ASSOCIATES INC /MD/ | 460.8K | $141.1M | increased |
| CONGRESS ASSET MANAGEMENT CO | 431.0K | $132.0M | decreased |
| T. Rowe Price Investment Management, Inc. | 417.5K | $127.9M | decreased |
Every 13F filer's complete reported book, every quarter since 2013-06-30. 13F itself excludes short positions, cash and most options.
Insider Trading
Net shares bought (+) or sold (−) on the open market by NPO insiders, by quarter · Form 4
Recent Insider Transactions
1,278 transactions on record · newest first
| Insider | Type | Shares | Price | Value | Date | |
|---|---|---|---|---|---|---|
| Bower Steven R.SVP, Controller and CAO | Sale | −1,000 | $279.66 | $280K | Nov 13, 2026 | Form 4 ↗ |
| Bianchi AmyEVP and CHRO | Tax withholding | −189 | $283.94 | $54K | Sep 15, 2026 | Form 4 ↗ |
| Bianchi AmyEVP and CHRO | Option exercise | +524 | $0.00 | $0 | Sep 15, 2026 | Form 4 ↗ |
| Bower Steven R.SVP, Controller and CAO | Sale | −507 | $265.15 | $134K | Mar 2, 2026 | Form 4 ↗ |
| Bower Steven R.SVP, Controller and CAO | Option exercise | +1,551 | $53.78 | $83K | Mar 2, 2026 | Form 4 ↗ |
| Humphrey JohnDirector | Sale | −1,300 | $268.69 | $349K | Feb 25, 2026 | Form 4 ↗ |
| McLean Robert SavageEVP, GC, and CAO | Sale | −2,000 | $277.50 | $555K | Feb 24, 2026 | Form 4 ↗ |
| Brueck Felix M.Director | Sale | −4,822 | $275.69 | $1.3M | Feb 23, 2026 | Form 4 ↗ |
| Brueck Felix M.Director | Sale | −1,031 | $276.52 | $285K | Feb 23, 2026 | Form 4 ↗ |
| Vaillancourt Eric A.President and CEO · Director | Tax withholding | −7,480 | $272.63 | $2.0M | Feb 16, 2026 | Form 4 ↗ |
| Vaillancourt Eric A.President and CEO · Director | Option exercise | +4,011 | $0.00 | $0 | Feb 16, 2026 | Form 4 ↗ |
| Vaillancourt Eric A.President and CEO · Director | Grant / award | +13.4K | $0.00 | $0 | Feb 16, 2026 | Form 4 ↗ |
| McLean Robert SavageEVP, GC, and CAO | Tax withholding | −1,295 | $272.63 | $353K | Feb 16, 2026 | Form 4 ↗ |
| McLean Robert SavageEVP, GC, and CAO | Option exercise | +774 | $0.00 | $0 | Feb 16, 2026 | Form 4 ↗ |
| McLean Robert SavageEVP, GC, and CAO | Grant / award | +2,589 | $0.00 | $0 | Feb 16, 2026 | Form 4 ↗ |
| Joiner Larisa R.SVP and CIO | Tax withholding | −473 | $272.63 | $129K | Feb 16, 2026 | Form 4 ↗ |
| Joiner Larisa R.SVP and CIO | Option exercise | +256 | $0.00 | $0 | Feb 16, 2026 | Form 4 ↗ |
| Joiner Larisa R.SVP and CIO | Grant / award | +854 | $0.00 | $0 | Feb 16, 2026 | Form 4 ↗ |
| Bower Steven R.SVP, Controller and CAO | Tax withholding | −365 | $272.63 | $100K | Feb 16, 2026 | Form 4 ↗ |
| Bower Steven R.SVP, Controller and CAO | Option exercise | +280 | $0.00 | $0 | Feb 16, 2026 | Form 4 ↗ |
Fund Holders
Mutual funds and ETFs holding NPO · SEC Form N-PORT
| Fund | Shares | Value | % of fund | As of |
|---|---|---|---|---|
| iShares Core S&P Small-Cap ETF iShares Trust | 1.3M | $479.7M | 0.43% | Jun 30, 2026 |
| SMALLCAP World Fund Inc | 1.2M | $463.1M | 0.49% | Jun 30, 2026 |
| VANGUARD TOTAL STOCK MARKET INDEX FUND VANGUARD INDEX FUNDS | 669.8K | $252.5M | 0.01% | Jun 30, 2026 |
| iShares Russell 2000 ETF iShares Trust | 553.5K | $208.6M | 0.25% | Jun 30, 2026 |
| VANGUARD SMALL-CAP INDEX FUND VANGUARD INDEX FUNDS | 484.7K | $182.7M | 0.10% | Jun 30, 2026 |
| VANGUARD SMALL-CAP VALUE INDEX FUND VANGUARD INDEX FUNDS | 306.9K | $115.7M | 0.17% | Jun 30, 2026 |
| Fidelity Low-Priced Stock Fund Fidelity Puritan Trust | 329.4K | $103.4M | 0.42% | Jul 31, 2026 |
| VANGUARD EXTENDED MARKET INDEX FUND VANGUARD INDEX FUNDS | 242.3K | $91.3M | 0.09% | Jun 30, 2026 |
| Invesco Discovery Fund AIM Counselor Series Trust (Invesco Counselor Series Trust) | 285.8K | $84.7M | 1.14% | Aug 31, 2026 |
| Fidelity Small Cap Index Fund Fidelity Salem Street Trust | 235.7K | $74.0M | 0.22% | Jul 31, 2026 |
Mutual funds and ETFs whose N-PORT filings list NPO's shares (CUSIP 29355X107), each fund at its latest report since Apr 21, 2026, largest positions first. Bonds, options and short positions are left out.
Activist & Passive Stakes
Schedule 13D / 13G beneficial-ownership filings
- BlackRock, Inc.SCHEDULE 13G/A · passive (13G) · 3.0M shares14.5%
Jul 17, 2025 · ↗
Corporate Lobbying
Estimated quarterly lobbying spending reported under the LDA, filings naming enpro as client
Government Contracts
Federal awards to Enpro Inc. · USAspending
No federal contract awards found for Enpro Inc..
U.S. Patents
Recent USPTO applications naming Enpro Inc.
No USPTO patent applications found for Enpro Inc..
Annual Financials
From NPO's 10-K filings · XBRL
| Fiscal year | FY2025 | FY2024 | FY2023 | FY2022 | FY2021 |
|---|---|---|---|---|---|
| Revenue | n/a | $1.05B | $1.06B | $1.10B | n/a |
| Operating income | $161.6M | $142.3M | $76.8M | $72.2M | $65.4M |
| Net income | $40.5M | $72.9M | $22.2M | $205.1M | $177.9M |
| Diluted EPS | $1.91 | $3.45 | $1.05 | $9.83 | $8.57 |
| Cash and equivalents | $114.7M | $236.3M | $369.8M | $334.4M | $338.1M |
| Total assets | $2.66B | $2.49B | $2.50B | $2.65B | $2.97B |
| Total liabilities | $1.12B | $1.06B | $1.07B | $1.23B | $1.65B |
| Shareholders' equity | $1.54B | $1.43B | $1.41B | $1.40B | $1.27B |
As Enpro Inc. tagged them in its 10-K filings: totals for the year on the income and cash-flow lines, values at the year's end on the balance-sheet lines. Latest 10-K, filed Feb 19, 2026 ↗
Stock Splits
Every split and reverse split in the price history
No stock splits in NPO's price history.
About Enpro Inc.
From SEC EDGAR company records
Industry (SIC 3050)Gaskets, Packg & Sealg Devices & Rubber & Plastics Hose
SectorIndustrials
HeadquartersCHARLOTTE, NC
IncorporatedNC
SEC CIK0001164863 ↗
Former namesENPRO INDUSTRIES, INC, ENPRO INDUSTRIES INC