

Stocks › NOVT

NOVANTA INC
NOVT·Nasdaq· United States·USD
$101.99
-12.89 (-11.22%)
Close · Nov 20, 2026 · Close Prices from Tiingo.com
NOVT
NOVANTA INC · Nasdaq
Nasdaq 100S&P 500
Filings
Default90D1Y5YALL
NOVTS&P 500 (rebased)
Congress BuyCongress SellInsider BuyInsider SellForm 1448-K ResultsLobbying
Loading price history…
Daily closes, adjusted for splits and dividends · Close Prices from Tiingo.comHover a marker, every one is a filing · move across the line for the crosshair
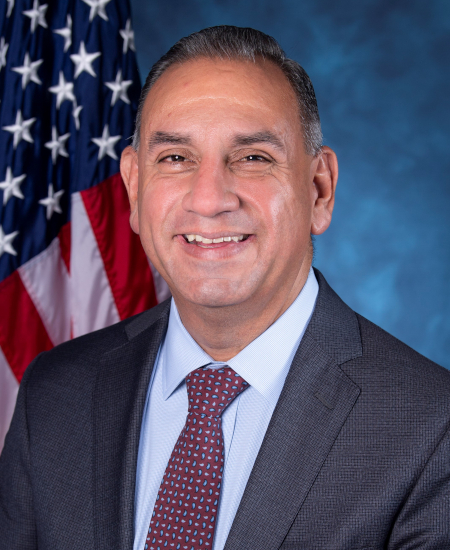
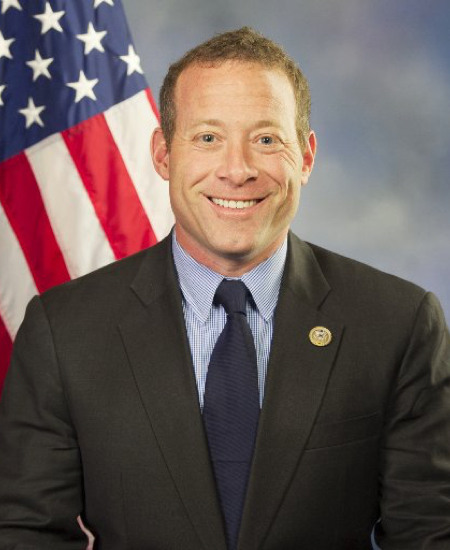
Congressional Trades
Recent trades of NOVT by members of U.S. Congress · 10 on record · 2 in the last 12 months

Whale Activity
Position changes in NOVT reported for 2026-09-30 by 423 institutional filers
- Increased157
- New39
- Held59
- Decreased110
- Closed41
- No prior filing17
| Filer | Shares | Value | Change |
|---|---|---|---|
| BlackRock, Inc. | 4.9M | $701.2M | increased |
| VANGUARD PORTFOLIO MANAGEMENT LLC | 2.4M | $343.3M | increased |
| PRICE T ROWE ASSOCIATES INC /MD/ | 2.1M | $292.2M | decreased |
| VANGUARD CAPITAL MANAGEMENT LLC | 1.7M | $241.3M | increased |
| Allspring Global Investments Holdings, LLC | 1.6M | $236.1M | decreased |
| STATE STREET CORP | 1.5M | $210.4M | increased |
| WASATCH ADVISORS LP | 1.1M | $149.6M | increased |
| GEODE CAPITAL MANAGEMENT, LLC | 1.0M | $146.3M | increased |
| CONGRESS ASSET MANAGEMENT CO | 979.8K | $139.3M | increased |
| GW&K Investment Management, LLC | 899.3K | $127.9M | increased |
| GOLDMAN SACHS GROUP INC | 892.6K | $126.9M | increased |
| Conestoga Capital Advisors, LLC | 832.2K | $118.3M | decreased |
Every 13F filer's complete reported book, every quarter since 2013-06-30. 13F itself excludes short positions, cash and most options.
Insider Trading
Net shares bought (+) or sold (−) on the open market by NOVT insiders, by quarter · Form 4
Recent Insider Transactions
728 transactions on record · newest first
| Insider | Type | Shares | Price | Value | Date | |
|---|---|---|---|---|---|---|
| Secor Thomas NDirector | Sale | −663 | $147.60 | $98K | Sep 11, 2026 | Form 4 ↗ |
| Glastra MatthijsChief Executive Officer · Director | Sale | −200 | $164.20 | $33K | Jul 2, 2026 | Form 4 ↗ |
| Glastra MatthijsChief Executive Officer · Director | Sale | −437 | $163.71 | $72K | Jul 2, 2026 | Form 4 ↗ |
| Glastra MatthijsChief Executive Officer · Director | Sale | −1,167 | $162.01 | $189K | Jul 2, 2026 | Form 4 ↗ |
| Glastra MatthijsChief Executive Officer · Director | Sale | −1,672 | $161.28 | $270K | Jul 2, 2026 | Form 4 ↗ |
| Glastra MatthijsChief Executive Officer · Director | Sale | −3,024 | $160.13 | $484K | Jul 2, 2026 | Form 4 ↗ |
| Glastra MatthijsChief Executive Officer · Director | Sale | −400 | $171.28 | $69K | Jun 2, 2026 | Form 4 ↗ |
| Glastra MatthijsChief Executive Officer · Director | Sale | −1,301 | $169.76 | $221K | Jun 2, 2026 | Form 4 ↗ |
| Glastra MatthijsChief Executive Officer · Director | Sale | −2,841 | $168.76 | $479K | Jun 2, 2026 | Form 4 ↗ |
| Glastra MatthijsChief Executive Officer · Director | Sale | −1,420 | $167.68 | $238K | Jun 2, 2026 | Form 4 ↗ |
| Glastra MatthijsChief Executive Officer · Director | Sale | −500 | $166.19 | $83K | Jun 2, 2026 | Form 4 ↗ |
| Glastra MatthijsChief Executive Officer · Director | Sale | −38 | $164.61 | $6K | Jun 2, 2026 | Form 4 ↗ |
| Glastra MatthijsChief Executive Officer · Director | Sale | −2,421 | $151.34 | $366K | May 12, 2026 | Form 4 ↗ |
| Glastra MatthijsChief Executive Officer · Director | Sale | −5,079 | $150.00 | $762K | May 12, 2026 | Form 4 ↗ |
| Glastra MatthijsChief Executive Officer · Director | Sale | −23 | $133.27 | $3K | May 5, 2026 | Form 4 ↗ |
| Glastra MatthijsChief Executive Officer · Director | Sale | −1,180 | $132.51 | $156K | May 5, 2026 | Form 4 ↗ |
| Glastra MatthijsChief Executive Officer · Director | Sale | −1,022 | $131.75 | $135K | May 5, 2026 | Form 4 ↗ |
| Glastra MatthijsChief Executive Officer · Director | Sale | −4,275 | $130.59 | $558K | May 5, 2026 | Form 4 ↗ |
| Glastra MatthijsChief Executive Officer · Director | Sale | −6,500 | $130.05 | $845K | Apr 17, 2026 | Form 4 ↗ |
| Buckley RobertChief Financial Officer | Sale | −86 | $118.80 | $10K | Mar 16, 2026 | Form 4 ↗ |
Fund Holders
Mutual funds and ETFs holding NOVT · SEC Form N-PORT
| Fund | Shares | Value | % of fund | As of |
|---|---|---|---|---|
| iShares Core S&P Mid-Cap ETF iShares Trust | 1.2M | $197.8M | 0.16% | Jun 30, 2026 |
| VANGUARD TOTAL STOCK MARKET INDEX FUND VANGUARD INDEX FUNDS | 1.1M | $183.8M | 0.01% | Jun 30, 2026 |
| iShares Russell 2000 ETF iShares Trust | 931.6K | $151.1M | 0.18% | Jun 30, 2026 |
| VANGUARD SMALL-CAP INDEX FUND VANGUARD INDEX FUNDS | 817.0K | $132.6M | 0.07% | Jun 30, 2026 |
| T. Rowe Price Mid-Cap Value Fund, Inc. | 759.9K | $123.3M | 0.75% | Jun 30, 2026 |
| VANGUARD INFORMATION TECHNOLOGY INDEX FUND VANGUARD WORLD FUND | 762.7K | $111.5M | 0.07% | Aug 31, 2026 |
| CONESTOGA SMALL CAP FUND Conestoga Funds | 576.3K | $93.5M | 4.58% | Jun 30, 2026 |
| Allspring Special Mid Cap Value Fund ALLSPRING FUNDS TRUST | 519.2K | $84.2M | 0.63% | Jun 30, 2026 |
| VANGUARD SMALL-CAP GROWTH INDEX FUND VANGUARD INDEX FUNDS | 471.4K | $76.5M | 0.16% | Jun 30, 2026 |
| Allspring Special Small Cap Value Fund ALLSPRING FUNDS TRUST | 445.9K | $72.3M | 2.45% | Jun 30, 2026 |
Mutual funds and ETFs whose N-PORT filings list NOVT's shares (CUSIP 67000B104), each fund at its latest report since Apr 21, 2026, largest positions first. Bonds, options and short positions are left out.
Activist & Passive Stakes
Schedule 13D / 13G beneficial-ownership filings
Corporate Lobbying
Estimated quarterly lobbying spending reported under the LDA, filings naming NOVANTA INC as client
No lobbying filings found naming NOVANTA INC as the client.
Government Contracts
Federal awards to NOVANTA INC · USAspending
No federal contract awards found for NOVANTA INC.
U.S. Patents
Recent USPTO applications naming NOVANTA INC
No USPTO patent applications found for NOVANTA INC.
Annual Financials
From NOVT's 10-K filings · XBRL
| Fiscal year | FY2025 | FY2024 | FY2023 | FY2022 | FY2021 |
|---|---|---|---|---|---|
| Revenue | $980.6M | $949.2M | $881.7M | $860.9M | $706.8M |
| Operating income | $94.0M | $110.6M | $110.5M | $103.1M | $64.1M |
| Net income | $53.8M | $64.1M | $72.9M | $74.1M | $50.3M |
| Diluted EPS | $1.47 | $1.77 | $2.02 | $2.06 | $1.41 |
| Operating cash flow | $64.1M | $158.5M | $120.1M | $90.8M | $94.6M |
| Cash and equivalents | $380.9M | $114.0M | $105.1M | $100.1M | $117.4M |
| Total assets | $1.81B | $1.39B | $1.23B | $1.24B | $1.23B |
| Total liabilities | $492.8M | $642.8M | $552.6M | $663.6M | $706.6M |
| Shareholders' equity | $1.31B | $745.7M | $673.5M | $577.6M | $521.3M |
As NOVANTA INC tagged them in its 10-K filings: totals for the year on the income and cash-flow lines, values at the year's end on the balance-sheet lines. Latest 10-K, filed Feb 23, 2026 ↗
Stock Splits
Every split and reverse split in the price history
No stock splits in NOVT's price history.
Material Events (8-K)
Corporate events filed with the SEC
- 8-K · Items 2.02, 9.01Results of operationsNov 9, 2026
EDGAR ↗ - 8-K/A · Items 9.01Oct 2, 2026
EDGAR ↗ - 8-K · Items 2.02, 9.01Results of operationsAug 5, 2026
EDGAR ↗ - 8-K · Items 2.01, 2.03, 7.01, 9.01Acquisition or disposition · Direct financial obligation · Reg FD disclosureJul 27, 2026
EDGAR ↗ - 8-K · Items 1.01, 3.02, 8.01, 9.01Material agreement · Unregistered sale of equity · Other eventsJun 9, 2026
EDGAR ↗ - 8-K · Items 1.01, 7.01, 9.01Material agreement · Reg FD disclosureJun 9, 2026
EDGAR ↗ - 8-K · Items 5.07Shareholder voteMay 29, 2026
EDGAR ↗ - 8-K · Items 1.01, 2.03, 9.01Material agreement · Direct financial obligationMay 15, 2026
EDGAR ↗ - 8-K · Items 2.02, 9.01Results of operationsMay 11, 2026
EDGAR ↗
About NOVANTA INC
From SEC EDGAR company records
Industry (SIC 3690)Miscellaneous Electrical Machinery, Equipment & Supplies
SectorTechnology
HeadquartersBEDFORD, MA
IncorporatedA3
SEC CIK0001076930 ↗
Former namesGSI GROUP INC, GSI LUMONICS INC, GSI LUMONICS