

Stocks › NDAQ

NASDAQ, INC.
NDAQ·Nasdaq· United States·USD
$102.92
-1.03 (-0.99%)
Close · Nov 20, 2026 · Close Prices from Tiingo.com
NDAQ
NASDAQ, INC. · Nasdaq
Nasdaq 100S&P 500
Filings
Default90D1Y5YALL
NDAQS&P 500 (rebased)
Congress BuyCongress SellInsider BuyInsider SellForm 1448-K ResultsLobbying
Loading price history…
Daily closes, adjusted for splits and dividends · Close Prices from Tiingo.comHover a marker, every one is a filing · move across the line for the crosshair
Congressional Trades
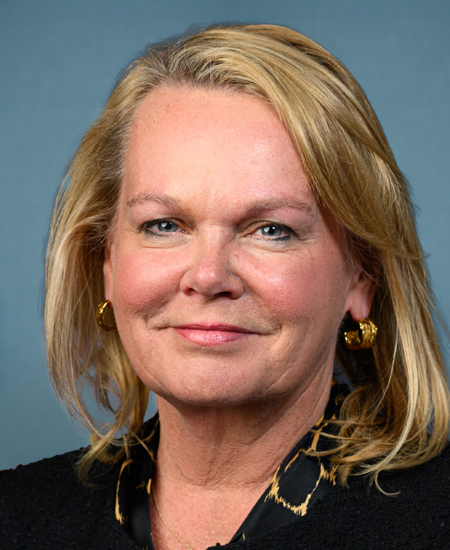
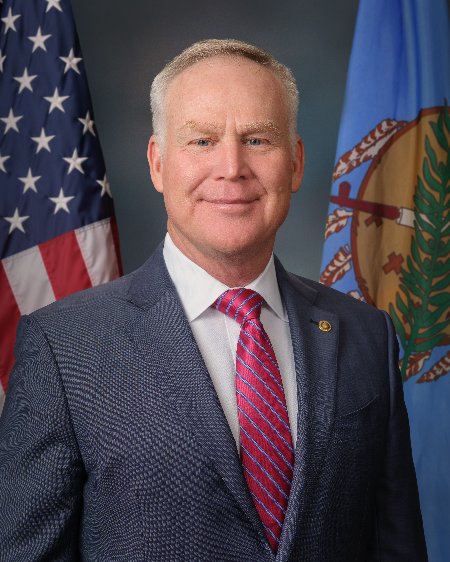
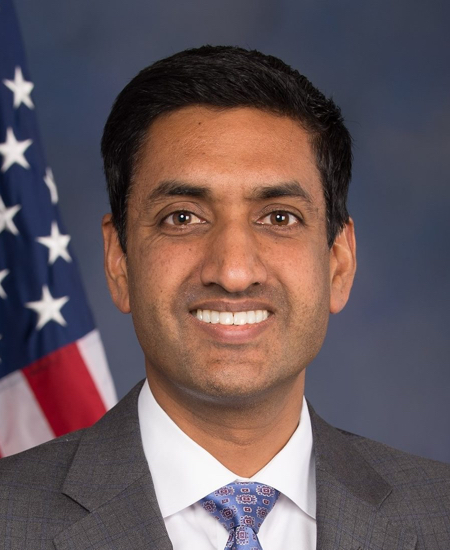
Recent trades of NDAQ by members of U.S. Congress · 152 on record · 26 in the last 12 months
Whale Activity
Position changes in NDAQ reported for 2026-09-30 by 1213 institutional filers
- Increased412
- New131
- Held140
- Decreased387
- Closed82
- No prior filing61
| Filer | Shares | Value | Change |
|---|---|---|---|
| INVESTOR AB | 58.4M | $5.38B | held |
| BlackRock, Inc. | 37.4M | $3.45B | increased |
| VANGUARD CAPITAL MANAGEMENT LLC | 30.9M | $2.85B | decreased |
| WELLINGTON MANAGEMENT GROUP LLP | 27.4M | $2.52B | decreased |
| VANGUARD PORTFOLIO MANAGEMENT LLC | 25.7M | $2.36B | decreased |
| STATE STREET CORP | 20.5M | $1.89B | increased |
| MASSACHUSETTS FINANCIAL SERVICES CO /MA/ | 19.2M | $1.76B | decreased |
| GEODE CAPITAL MANAGEMENT, LLC | 12.5M | $1.14B | decreased |
| FRANKLIN TEMPLETON INC | 8.9M | $978.3M | decreased |
| MORGAN STANLEY | 10.0M | $916.1M | decreased |
| BANK OF AMERICA CORP /DE/ | 8.6M | $792.0M | increased |
| UBS Group AG | 8.0M | $733.5M | increased |
Every 13F filer's complete reported book, every quarter since 2013-06-30. 13F itself excludes short positions, cash and most options.
Insider Trading
Net shares bought (+) or sold (−) on the open market by NDAQ insiders, by quarter · Form 4
Recent Insider Transactions
2,574 transactions on record · newest first
| Insider | Type | Shares | Price | Value | Date | |
|---|---|---|---|---|---|---|
| Peterson Bradley JEVP, CIO | Sale | −5,000 | $109.07 | $545K | Nov 12, 2026 | Form 4 ↗ |
| SKULE JEREMYEVP, CSO | Sale | −2,250 | $108.31 | $244K | Nov 10, 2026 | Form 4 ↗ |
| Tal CohenPres. Market Platforms | Sale | −2,286 | $109.40 | $250K | Nov 4, 2026 | Form 4 ↗ |
| Peterson Bradley JEVP, CIO | Sale | −5,000 | $107.75 | $539K | Nov 4, 2026 | Form 4 ↗ |
| Tal CohenPres. Market Platforms | Sale | −2,289 | $108.05 | $247K | Nov 3, 2026 | Form 4 ↗ |
| Peterson Bradley JEVP, CIO | Sale | −3,987 | $104.75 | $418K | Oct 27, 2026 | Form 4 ↗ |
| Tal CohenPres. Market Platforms | Sale | −10.4K | $103.34 | $1.1M | Oct 23, 2026 | Form 4 ↗ |
| Peterson Bradley JEVP, CIO | Sale | −4,000 | $103.38 | $414K | Oct 23, 2026 | Form 4 ↗ |
| SKULE JEREMYEVP, CSO | Sale | −1,125 | $95.00 | $107K | Oct 20, 2026 | Form 4 ↗ |
| SKULE JEREMYEVP, CSO | Sale | −1,125 | $94.13 | $106K | Oct 12, 2026 | Form 4 ↗ |
| SKULE JEREMYEVP, CSO | Sale | −1,125 | $95.00 | $107K | Sep 22, 2026 | Form 4 ↗ |
| SKULE JEREMYEVP, CSO | Sale | −1,125 | $94.22 | $106K | Sep 10, 2026 | Form 4 ↗ |
| SKULE JEREMYEVP, CSO | Sale | −2,250 | $94.75 | $213K | Aug 10, 2026 | Form 4 ↗ |
| Griggs PC NelsonPres. Capital Access Platforms | Sale | −3,226 | $96.16 | $310K | Aug 10, 2026 | Form 4 ↗ |
| Peterson Bradley JEVP, CIO | Sale | −6,000 | $95.55 | $573K | Aug 7, 2026 | Form 4 ↗ |
| Smith Bryan EverardEVP, CPO | Sale | −1,556 | $95.07 | $148K | Aug 3, 2026 | Form 4 ↗ |
| Griggs PC NelsonPres. Capital Access Platforms | Sale | −11.0K | $96.35 | $1.1M | Jul 29, 2026 | Form 4 ↗ |
| Griggs PC NelsonPres. Capital Access Platforms | Sale | −11.0K | $93.96 | $1.0M | Jul 27, 2026 | Form 4 ↗ |
| Peterson Bradley JEVP, CIO | Sale | −13.0K | $92.61 | $1.2M | Jul 24, 2026 | Form 4 ↗ |
| Griggs PC NelsonPres. Capital Access Platforms | Sale | −6,777 | $92.53 | $627K | Jul 24, 2026 | Form 4 ↗ |
Fund Holders
Mutual funds and ETFs holding NDAQ · SEC Form N-PORT
| Fund | Shares | Value | % of fund | As of |
|---|---|---|---|---|
| VANGUARD TOTAL STOCK MARKET INDEX FUND VANGUARD INDEX FUNDS | 16.2M | $1.27B | 0.06% | Jun 30, 2026 |
| VANGUARD 500 INDEX FUND VANGUARD INDEX FUNDS | 11.6M | $912.6M | 0.05% | Jun 30, 2026 |
| MFS Value Fund MFS SERIES TRUST I | 9.2M | $912.1M | 1.98% | Aug 31, 2026 |
| VANGUARD WELLINGTON FUND | 9.2M | $906.6M | 0.74% | Aug 31, 2026 |
| VANGUARD MID-CAP INDEX FUND VANGUARD INDEX FUNDS | 11.0M | $869.3M | 0.39% | Jun 30, 2026 |
| Fidelity 500 Index Fund Fidelity Concord Street Trust | 5.8M | $571.9M | 0.07% | Aug 31, 2026 |
| VANGUARD EQUITY INCOME FUND VANGUARD FENWAY FUNDS | 6.4M | $508.0M | 0.78% | Jun 30, 2026 |
| iShares Core S&P 500 ETF iShares Trust | 6.1M | $484.4M | 0.05% | Jun 30, 2026 |
| Franklin Rising Dividends Fund Franklin Managed Trust | 5.6M | $443.4M | 1.62% | Jun 30, 2026 |
| State Street(R) SPDR(R) S&P 500(R) ETF Trust | 5.4M | $426.8M | 0.05% | Jun 30, 2026 |
Mutual funds and ETFs whose N-PORT filings list NDAQ's shares (CUSIP 631103108), each fund at its latest report since Apr 21, 2026, largest positions first. Bonds, options and short positions are left out.
Activist & Passive Stakes
Schedule 13D / 13G beneficial-ownership filings
- Wellington Investment Advisors Holdings LLPSCHEDULE 13G/A · passive (13G) · 27.4M shares4.9%
Nov 16, 2026 · ↗ - Wellington Group Holdings LLPSCHEDULE 13G/A · passive (13G) · 27.4M shares4.9%
Nov 16, 2026 · ↗ - Wellington Management Group LLPSCHEDULE 13G/A · passive (13G) · 27.4M shares4.9%
Nov 16, 2026 · ↗ - BlackRock, Inc.SCHEDULE 13G/A · passive (13G) · 34.9M shares6.2%
Oct 27, 2026 · ↗ - Wellington Management Company LLPSCHEDULE 13G/A · passive (13G) · 30.3M shares5.1%
Aug 13, 2026 · ↗ - Wellington Investment Advisors Holdings LLPSCHEDULE 13G/A · passive (13G) · 30.3M shares5.4%
Aug 13, 2026 · ↗ - Wellington Group Holdings LLPSCHEDULE 13G/A · passive (13G) · 30.3M shares5.4%
Aug 13, 2026 · ↗ - Wellington Management Group LLPSCHEDULE 13G/A · passive (13G) · 30.3M shares5.4%
Aug 13, 2026 · ↗ - Massachusetts Financial Services CompanySCHEDULE 13G/A · passive (13G) · 23.3M shares4.1%
Aug 12, 2026 · ↗ - Massachusetts Financial Services CompanySCHEDULE 13G · passive (13G) · 29.1M shares5.1%
May 14, 2026 · ↗
Corporate Lobbying
Estimated quarterly lobbying spending reported under the LDA, filings naming nasdaq as client
- MILLER STRATEGIES, LLCNASDAQ, INC. · 2026 Q3 · FIN$150K
Filing ↗ - PORTERFIELD, FETTIG & SEARS, LLCNASDAQ INC · 2026 Q3 · FIN$70K
Filing ↗ - BAKER & HOSTETLER LLPNASDAQ, INC. · 2026 Q3 · FIN$90K
Filing ↗ - NASDAQ, INC.NASDAQ INC · 2026 Q3 · FIN$698K
Filing ↗ - PORTERFIELD, FETTIG & SEARS, LLCNASDAQ INC · 2026 Q2 · FIN$70K
Filing ↗
Government Contracts
Federal awards to NASDAQ, INC. · USAspending
No federal contract awards found for NASDAQ, INC..
U.S. Patents
Recent USPTO applications naming NASDAQ, INC.
No USPTO patent applications found for NASDAQ, INC..
Annual Financials
From NDAQ's 10-K filings · XBRL
| Fiscal year | FY2025 | FY2024 | FY2023 | FY2022 | FY2021 |
|---|---|---|---|---|---|
| Revenue | $8.26B | $7.40B | $6.06B | $6.23B | $5.89B |
| Operating income | $2.33B | $1.80B | $1.58B | $1.56B | $1.44B |
| Net income | $1.79B | $1.12B | $1.06B | $1.13B | $1.19B |
| Diluted EPS | $3.09 | $1.93 | $2.08 | $2.26 | $2.35 |
| Operating cash flow | $2.25B | $1.94B | $1.70B | $1.71B | $1.08B |
| Cash and equivalents | $604.0M | $592.0M | $453.0M | $502.0M | $393.0M |
| Total assets | $31.05B | $30.39B | $32.29B | $20.87B | $20.11B |
| Total liabilities | $18.82B | $19.20B | $21.47B | $14.70B | $13.71B |
| Shareholders' equity | $12.23B | $11.19B | $10.82B | $6.15B | $6.39B |
As NASDAQ, INC. tagged them in its 10-K filings: totals for the year on the income and cash-flow lines, values at the year's end on the balance-sheet lines. Latest 10-K, filed Feb 12, 2026 ↗
Stock Splits
Every split and reverse split in the price history
- 3-for-1Stock splitAug 29, 2022
Split dates and ratios from the price history · Close Prices from Tiingo.com
Material Events (8-K)
Corporate events filed with the SEC
- 8-K · Items 5.02Officer / director changeNov 18, 2026
EDGAR ↗ - 8-K · Items 5.02, 9.01Officer / director changeOct 26, 2026
EDGAR ↗ - 8-K · Items 2.02, 7.01, 8.01, 9.01Results of operations · Reg FD disclosure · Other eventsOct 22, 2026
EDGAR ↗ - 8-K · Items 2.02, 7.01, 8.01, 9.01Results of operations · Reg FD disclosure · Other eventsJul 23, 2026
EDGAR ↗ - 8-K · Items 1.01, 1.02, 2.03, 9.01Material agreement · Termination of agreement · Direct financial obligationJul 1, 2026
EDGAR ↗ - 8-K · Items 5.07Shareholder voteJun 16, 2026
EDGAR ↗
About NASDAQ, INC.
From SEC EDGAR company records
Industry (SIC 6200)Security & Commodity Brokers, Dealers, Exchanges & Services
SectorFinancials
HeadquartersNEW YORK, NY
IncorporatedDE
SEC CIK0001120193 ↗
Former namesNASDAQ OMX GROUP, INC., NASDAQ STOCK MARKET INC