

Stocks › MSCI

MSCI Inc.
MSCI·NYSE· United States·USD
$610.48
-13.85 (-2.22%)
Close · Nov 20, 2026 · Close Prices from Tiingo.com
MSCI
MSCI Inc. · NYSE
Nasdaq 100S&P 500
Filings
Default90D1Y5YALL
MSCIS&P 500 (rebased)
Congress BuyCongress SellInsider BuyInsider SellForm 1448-K ResultsLobbying
Loading price history…
Daily closes, adjusted for splits and dividends · Close Prices from Tiingo.comHover a marker, every one is a filing · move across the line for the crosshair
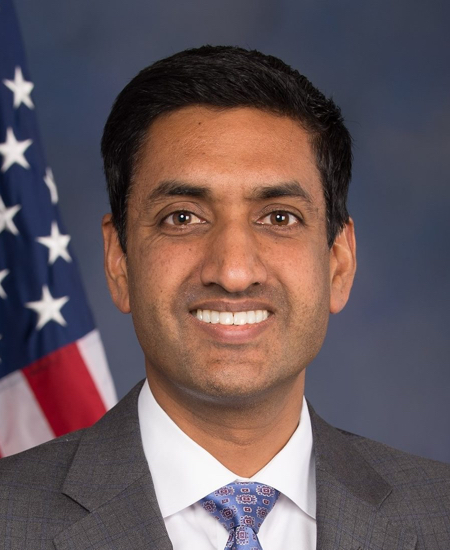
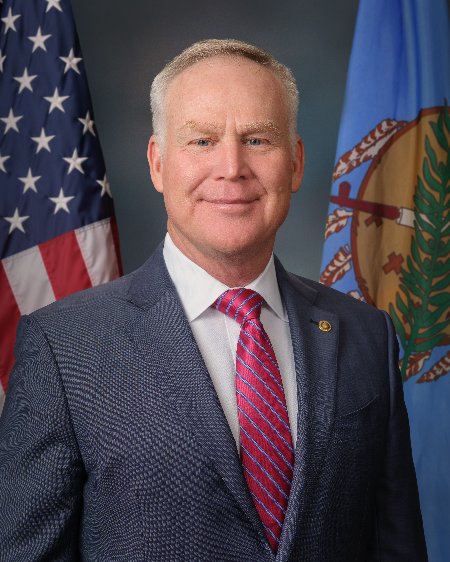
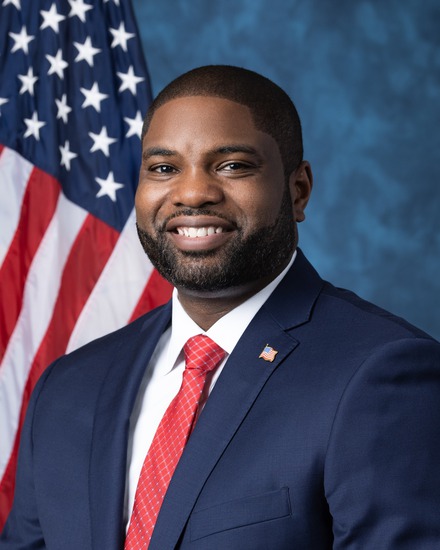
Congressional Trades
Recent trades of MSCI by members of U.S. Congress · 136 on record · 15 in the last 12 months


Whale Activity
Position changes in MSCI reported for 2026-09-30 by 1168 institutional filers
- Increased343
- New98
- Held143
- Decreased436
- Closed99
- No prior filing49
| Filer | Shares | Value | Change |
|---|---|---|---|
| BlackRock, Inc. | 5.5M | $2.98B | increased |
| VANGUARD CAPITAL MANAGEMENT LLC | 4.5M | $2.43B | decreased |
| VANGUARD PORTFOLIO MANAGEMENT LLC | 4.1M | $2.20B | decreased |
| STATE STREET CORP | 3.2M | $1.72B | increased |
| BAMCO INC /NY/ | 3.1M | $1.65B | decreased |
| T. Rowe Price Investment Management, Inc. | 2.8M | $1.53B | increased |
| MORGAN STANLEY | 2.4M | $1.31B | increased |
| GEODE CAPITAL MANAGEMENT, LLC | 2.0M | $1.06B | increased |
| VIKING GLOBAL INVESTORS LP | 1.6M | $837.5M | increased |
| Mitsubishi UFJ Asset Management Co., Ltd. | 1.2M | $657.6M | increased |
| PRINCIPAL FINANCIAL GROUP INC | 1.0M | $554.5M | — |
| WELLINGTON MANAGEMENT GROUP LLP | 966.2K | $520.5M | increased |
Every 13F filer's complete reported book, every quarter since 2013-06-30. 13F itself excludes short positions, cash and most options.
Insider Trading
Net shares bought (+) or sold (−) on the open market by MSCI insiders, by quarter · Form 4
Recent Insider Transactions
1,312 transactions on record · newest first
| Insider | Type | Shares | Price | Value | Date | |
|---|---|---|---|---|---|---|
| Gutowski Robert J.General Counsel | Sale | −2,381 | $623.66 | $1.5M | Oct 22, 2026 | Form 4 ↗ |
| Wiechmann Andrew C.Chief Financial Officer | Sale | −450 | $570.00 | $257K | Oct 12, 2026 | Form 4 ↗ |
| Taneja RajatDirector | Purchase | +1,786 | $560.00 | $1.0M | Sep 2, 2026 | Form 4 ↗ |
| Yang JuneDirector | Grant / award | +2 | $0.00 | $0 | Aug 28, 2026 | Form 4 ↗ |
| Matlock RobinDirector | Grant / award | +6 | $0.00 | $0 | Aug 28, 2026 | Form 4 ↗ |
| RIEFLER LINDA HDirector | Grant / award | +8 | $0.00 | $0 | Aug 28, 2026 | Form 4 ↗ |
| Wiechmann Andrew C.Chief Financial Officer | Sale | −450 | $604.56 | $272K | Jun 10, 2026 | Form 4 ↗ |
| Taneja RajatDirector | Grant / award | +42 | $0.00 | $0 | Jun 2, 2026 | Form 4 ↗ |
| Yang JuneDirector | Grant / award | +2 | $0.00 | $0 | May 29, 2026 | Form 4 ↗ |
| Matlock RobinDirector | Grant / award | +6 | $0.00 | $0 | May 29, 2026 | Form 4 ↗ |
| RIEFLER LINDA HDirector | Grant / award | +7 | $0.00 | $0 | May 29, 2026 | Form 4 ↗ |
| Fernandez Henry AChairman and CEO · Director | Purchase | +80 | $565.17 | $45K | May 15, 2026 | Form 4 ↗ |
| Fernandez Henry AChairman and CEO · Director | Purchase | +400 | $564.42 | $226K | May 15, 2026 | Form 4 ↗ |
| Fernandez Henry AChairman and CEO · Director | Purchase | +800 | $563.39 | $451K | May 15, 2026 | Form 4 ↗ |
| Fernandez Henry AChairman and CEO · Director | Purchase | +1,122 | $562.47 | $631K | May 15, 2026 | Form 4 ↗ |
| Fernandez Henry AChairman and CEO · Director | Purchase | +1,238 | $561.56 | $695K | May 15, 2026 | Form 4 ↗ |
| Fernandez Henry AChairman and CEO · Director | Purchase | +240 | $560.28 | $134K | May 15, 2026 | Form 4 ↗ |
| Fernandez Henry AChairman and CEO · Director | Purchase | +120 | $559.40 | $67K | May 15, 2026 | Form 4 ↗ |
| Yang JuneDirector | Grant / award | +388 | $0.00 | $0 | May 1, 2026 | Form 4 ↗ |
| Seitz MichelleDirector | Grant / award | +388 | $0.00 | $0 | May 1, 2026 | Form 4 ↗ |
Fund Holders
Mutual funds and ETFs holding MSCI · SEC Form N-PORT
| Fund | Shares | Value | % of fund | As of |
|---|---|---|---|---|
| VANGUARD TOTAL STOCK MARKET INDEX FUND VANGUARD INDEX FUNDS | 2.2M | $1.24B | 0.05% | Jun 30, 2026 |
| VANGUARD 500 INDEX FUND VANGUARD INDEX FUNDS | 1.9M | $1.06B | 0.06% | Jun 30, 2026 |
| VANGUARD MID-CAP INDEX FUND VANGUARD INDEX FUNDS | 1.5M | $842.9M | 0.38% | Jun 30, 2026 |
| Baron Partners Fund BARON SELECT FUNDS | 1.3M | $755.1M | 4.18% | Jun 30, 2026 |
| iShares Core S&P 500 ETF iShares Trust | 1.0M | $560.6M | 0.06% | Jun 30, 2026 |
| Fidelity 500 Index Fund Fidelity Concord Street Trust | 945.0K | $539.3M | 0.06% | Aug 31, 2026 |
| State Street(R) SPDR(R) S&P 500(R) ETF Trust | 882.2K | $494.1M | 0.06% | Jun 30, 2026 |
| VANGUARD GROWTH INDEX FUND VANGUARD INDEX FUNDS | 834.0K | $467.1M | 0.12% | Jun 30, 2026 |
| MidCap Fund Principal Funds, Inc | 733.9K | $420.0M | 1.82% | Jul 31, 2026 |
| Baron Generational Growth Fund BARON INVESTMENT FUNDS TRUST (f/k/a BARON ASSET FUND) | 732.0K | $409.9M | 19.46% | Jun 30, 2026 |
Mutual funds and ETFs whose N-PORT filings list MSCI's shares (CUSIP 55354G100), each fund at its latest report since Apr 22, 2026, largest positions first. Bonds, options and short positions are left out.
Activist & Passive Stakes
Schedule 13D / 13G beneficial-ownership filings
No 13D/13G beneficial-ownership filings on record.
Corporate Lobbying
Estimated quarterly lobbying spending reported under the LDA, filings naming msci as client
- MEHLMAN CONSULTING, INC.MSCI, INC. · 2026 Q3 · FIN, DEF$50K
Filing ↗ - MEHLMAN CONSULTING, INC.MSCI, INC. · 2026 Q2 · DEF, FIN$50K
Filing ↗ - MEHLMAN CONSULTING, INC.MSCI, INC. · 2026 Q1 · FIN$50K
Filing ↗ - MEHLMAN CONSULTING, INC.MSCI, INC. · 2025 Q4 · FIN$50K
Filing ↗ - MEHLMAN CONSULTING, INC.MSCI, INC. · 2025 Q3 · FIN$50K
Filing ↗
Government Contracts
Federal awards to msci · USAspending
$349KAwarded · 4 contracts on record
- Department of the TreasuryREAL CAPITAL ANALYTICS DATA SUBSCRIPTION$31K
Sep 30, 2026 · ↗ - Securities and Exchange CommissionSUBSCRIPTION TO ENVIRONMENTAL, SOCIAL AND GOVERNANCE (ESG) DATA.$172K
Apr 1, 2023 · ↗ - Department of CommerceMARKET PRICING INDEX DATA SUBSCRIPTION$41K
Aug 15, 2019 · ↗ - U.S. International Development Finance CorporationPRIVATE CAPITAL BENCHMARK CALCULATOR - UNIVERSE ANALYTICS$106K
Sep 15, 2024 · ↗
U.S. Patents
Recent USPTO applications naming MSCI Inc.
No USPTO patent applications found for MSCI Inc..
Annual Financials
From MSCI's 10-K filings · XBRL
| Fiscal year | FY2025 | FY2024 | FY2023 | FY2022 | FY2021 |
|---|---|---|---|---|---|
| Revenue | $3.13B | $2.86B | $2.53B | $2.25B | $2.04B |
| Operating income | $1.71B | $1.53B | $1.38B | $1.21B | $1.07B |
| Net income | $1.20B | $1.11B | $1.15B | $870.6M | $726.0M |
| Diluted EPS | $15.69 | $14.05 | $14.39 | $10.72 | $8.70 |
| Operating cash flow | $1.59B | $1.50B | $1.24B | $1.10B | $936.1M |
| Cash and equivalents | $515.3M | $409.4M | $461.7M | $993.6M | $1.42B |
| Total assets | $5.70B | $5.45B | $5.52B | $5.00B | $5.51B |
| Total liabilities | $8.36B | $6.39B | $6.26B | $6.01B | $5.67B |
| Shareholders' equity | -$2.65B | -$940.0M | -$739.8M | -$1.01B | -$163.5M |
As MSCI Inc. tagged them in its 10-K filings: totals for the year on the income and cash-flow lines, values at the year's end on the balance-sheet lines. Latest 10-K, filed Feb 6, 2026 ↗
Stock Splits
Every split and reverse split in the price history
No stock splits in MSCI's price history.
About MSCI Inc.
From SEC EDGAR company records
Industry (SIC 7389)Services-Business Services, NEC
SectorIndustrials
HeadquartersNEW YORK, NY
IncorporatedDE
SEC CIK0001408198 ↗