


Interactive Brokers Group, Inc.
 United States·USD
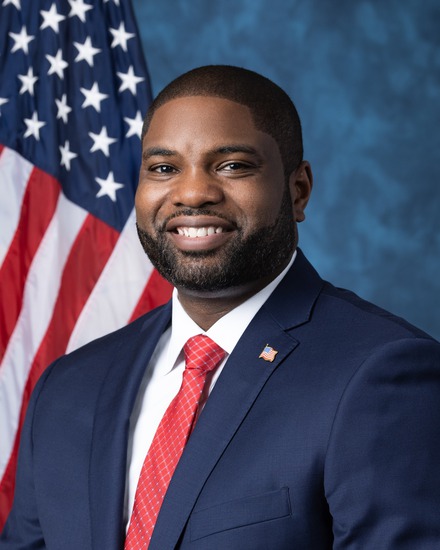
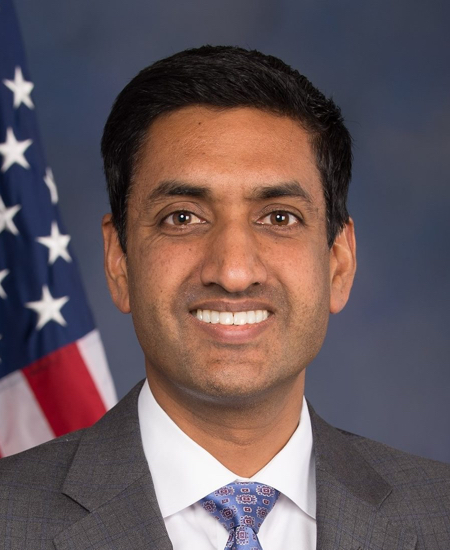
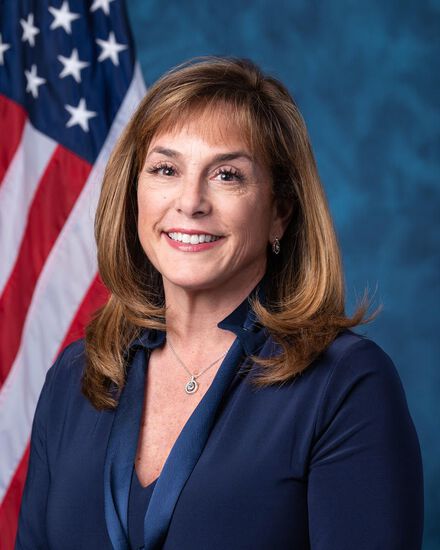
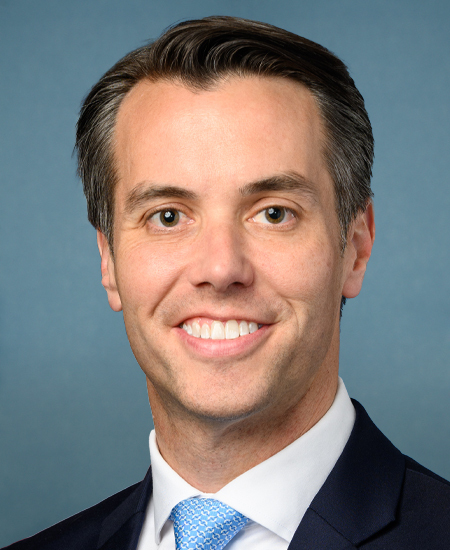
Congressional Trades
Whale Activity
- Increased439
- New111
- Held165
- Decreased359
- Closed89
- No prior filing56
| Filer | Shares | Value | Change |
|---|---|---|---|
| BlackRock, Inc. | 38.3M | $3.27B | increased |
| VANGUARD CAPITAL MANAGEMENT LLC | 28.9M | $2.47B | increased |
| STATE STREET CORP | 19.7M | $1.68B | increased |
| GEODE CAPITAL MANAGEMENT, LLC | 11.0M | $932.6M | increased |
| Greenwich Wealth Management LLC | 9.9M | $847.5M | decreased |
| Invesco Ltd. | 9.9M | $846.9M | increased |
| VANGUARD PORTFOLIO MANAGEMENT LLC | 9.5M | $807.6M | increased |
| TWO SIGMA INVESTMENTS, LP | 7.2M | $614.9M | decreased |
| BANK OF AMERICA CORP /DE/ | 7.2M | $611.2M | increased |
| WELLINGTON MANAGEMENT GROUP LLP | 7.0M | $598.1M | decreased |
| Orbis Allan Gray Ltd | 6.1M | $523.4M | increased |
| GQG Partners LLC | 6.1M | $520.5M | new |
Every 13F filer's complete reported book, every quarter since 2013-06-30. 13F itself excludes short positions, cash and most options.
Insider Trading
Recent Insider Transactions
| Insider | Type | Shares | Price | Value | Date | |
|---|---|---|---|---|---|---|
| Conkling Lori ADirector · Director | Purchase | +25 | $78.44 | $2K | Nov 2, 2026 | Form 4 ↗ |
| Harris Lawrence EDirector · Director | Sale | −25.0K | $82.61 | $2.1M | Oct 28, 2026 | Form 4 ↗ |
| Conkling Lori ADirector · Director | Purchase | +25 | $85.42 | $2K | Oct 1, 2026 | Form 4 ↗ |
| Conkling Lori ADirector | Purchase | +25 | $94.53 | $2K | Sep 1, 2026 | Form 4 ↗ |
| Conkling Lori ADirector | Purchase | +25 | $87.03 | $2K | Aug 3, 2026 | Form 4 ↗ |
| Nemser Earl HVice Chairman · Director | Grant / award | +803.6K | $87.99 | $70.7M | Jul 31, 2026 | Form 4 ↗ |
| Conkling Lori ADirector | Purchase | +25 | $88.03 | $2K | Jul 1, 2026 | Form 4 ↗ |
| Conkling Lori ADirector | Purchase | +25 | $86.10 | $2K | Jun 1, 2026 | Form 4 ↗ |
| Brody Paul JonathanChief Financial Officer · Director | Tax withholding | −82.9K | $84.42 | $7.0M | May 8, 2026 | Form 4 ↗ |
| Mendonca DenisChief Accounting Officer | Tax withholding | −11.2K | $84.42 | $942K | May 8, 2026 | Form 4 ↗ |
| Galik MilanChief Executive Officer · Director | Tax withholding | −255.0K | $84.42 | $21.5M | May 8, 2026 | Form 4 ↗ |
| Frank Thomas AJExecutive Vice President | Tax withholding | −31.7K | $84.42 | $2.7M | May 8, 2026 | Form 4 ↗ |
| Nemser Earl HVice Chairman · Director | Tax withholding | −22.5K | $84.42 | $1.9M | May 8, 2026 | Form 4 ↗ |
| Conkling Lori ADirector | Purchase | +25 | $79.64 | $2K | May 1, 2026 | Form 4 ↗ |
| Harris Lawrence EDirector | Sale | −26.0K | $76.93 | $2.0M | Apr 28, 2026 | Form 4 ↗ |
| Conkling Lori ADirector | Purchase | +25 | $68.38 | $2K | Apr 1, 2026 | Form 4 ↗ |
| Conkling Lori ADirector | Purchase | +25 | $69.21 | $2K | Mar 2, 2026 | Form 4 ↗ |
| Conkling Lori ADirector | Purchase | +50 | $73.21 | $4K | Feb 25, 2026 | Form 4 ↗ |
| Nemser Earl HVice Chairman · Director | Sale | −20.5K | $75.75 | $1.6M | Jan 27, 2026 | Form 4 ↗ |
| Nemser Earl HVice Chairman · Director | Sale | −39.7K | $75.07 | $3.0M | Jan 27, 2026 | Form 4 ↗ |
Fund Holders
| Fund | Shares | Value | % of fund | As of |
|---|---|---|---|---|
| VANGUARD TOTAL STOCK MARKET INDEX FUND VANGUARD INDEX FUNDS | 13.4M | $1.17B | 0.05% | Jun 30, 2026 |
| VANGUARD 500 INDEX FUND VANGUARD INDEX FUNDS | 11.5M | $1.00B | 0.06% | Jun 30, 2026 |
| Fidelity 500 Index Fund Fidelity Concord Street Trust | 5.8M | $562.6M | 0.07% | Aug 31, 2026 |
| iShares Core S&P 500 ETF iShares Trust | 6.1M | $533.4M | 0.06% | Jun 30, 2026 |
| State Street(R) SPDR(R) S&P 500(R) ETF Trust | 5.4M | $469.9M | 0.06% | Jun 30, 2026 |
| Fidelity Magellan Fund | 5.2M | $451.9M | 1.20% | Jun 30, 2026 |
| Invesco American Franchise Fund AIM Counselor Series Trust (Invesco Counselor Series Trust) | 4.1M | $394.1M | 2.26% | Aug 31, 2026 |
| New Economy Fund | 3.2M | $311.3M | 0.62% | Aug 31, 2026 |
| Ultra Fund American Century Mutual Funds, Inc. | 3.5M | $304.4M | 1.18% | Jul 31, 2026 |
| State Street(R) Financial Select Sector SPDR(R) ETF SELECT SECTOR SPDR TRUST | 3.0M | $262.3M | 0.51% | Jun 30, 2026 |
Mutual funds and ETFs whose N-PORT filings list IBKR's shares (CUSIP 45841N107), each fund at its latest report since Apr 21, 2026, largest positions first. Bonds, options and short positions are left out.
Activist & Passive Stakes
No 13D/13G beneficial-ownership filings on record.
Corporate Lobbying
No lobbying filings found naming Interactive Brokers Group, Inc. as the client.
Government Contracts
No federal contract awards found for Interactive Brokers Group, Inc..
U.S. Patents
No USPTO patent applications found for Interactive Brokers Group, Inc..
Annual Financials
| Fiscal year | FY2025 | FY2024 | FY2023 | FY2022 | FY2021 |
|---|---|---|---|---|---|
| Revenue | $2.44B | $1.98B | $1.56B | $1.51B | $1.57B |
| Diluted EPS | $2.22 | $1.73 | $1.42 | $3.75 | $3.24 |
| Operating cash flow | $15.81B | $8.72B | $4.54B | $3.97B | $5.90B |
| Cash and equivalents | $4.96B | $3.63B | $3.75B | $3.44B | $2.40B |
| Total assets | $203.24B | $150.14B | $128.25B | $115.14B | $109.11B |
| Total liabilities | $182.77B | $133.54B | $114.18B | $103.53B | $98.89B |
| Shareholders' equity | $5.36B | $4.28B | $3.58B | $2.85B | $2.40B |
As Interactive Brokers Group, Inc. tagged them in its 10-K filings: totals for the year on the income and cash-flow lines, values at the year's end on the balance-sheet lines. Latest 10-K, filed Feb 27, 2026 ↗
Stock Splits
- 4-for-1Stock splitJun 18, 2025
Split dates and ratios from the price history · Close Prices from Tiingo.com