

Stocks › GMED

GLOBUS MEDICAL INC
GMED·NYSE· United States·USD
$66.89
-1.71 (-2.49%)
Close · Nov 20, 2026 · Close Prices from Tiingo.com
GMED
GLOBUS MEDICAL INC · NYSE
Nasdaq 100S&P 500
Filings
Default90D1Y5YALL
GMEDS&P 500 (rebased)
Congress BuyCongress SellInsider BuyInsider SellForm 1448-K ResultsLobbying
Loading price history…
Daily closes, adjusted for splits and dividends · Close Prices from Tiingo.comHover a marker, every one is a filing · move across the line for the crosshair
Congressional Trades
Recent trades of GMED by members of U.S. Congress · 36 on record · 3 in the last 12 months
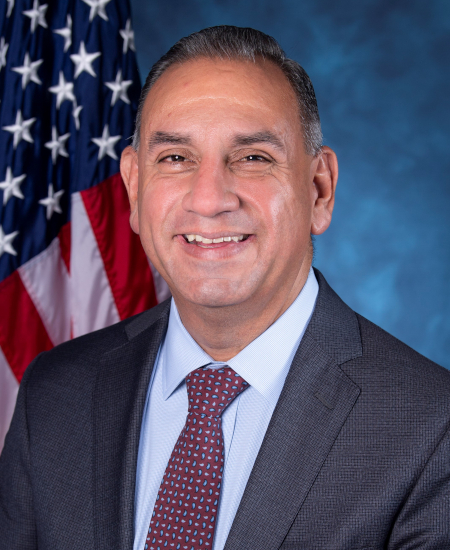
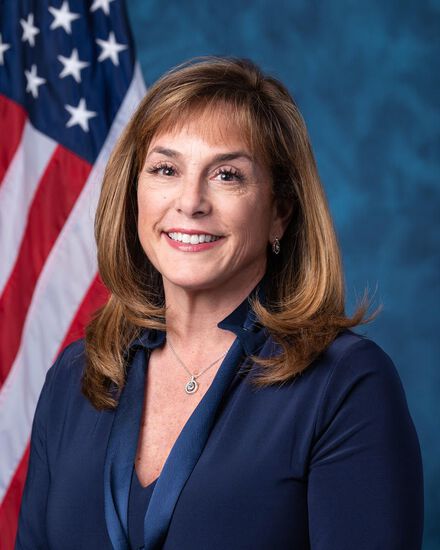
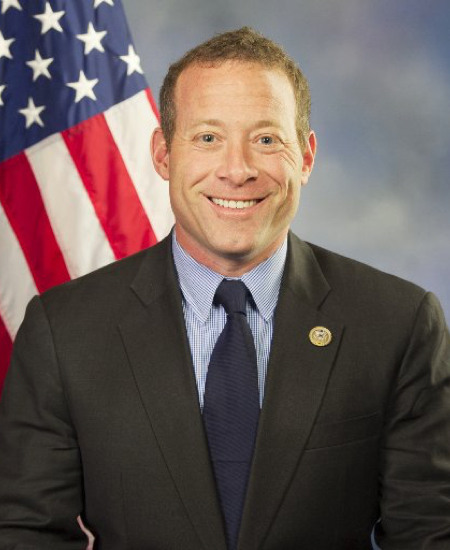

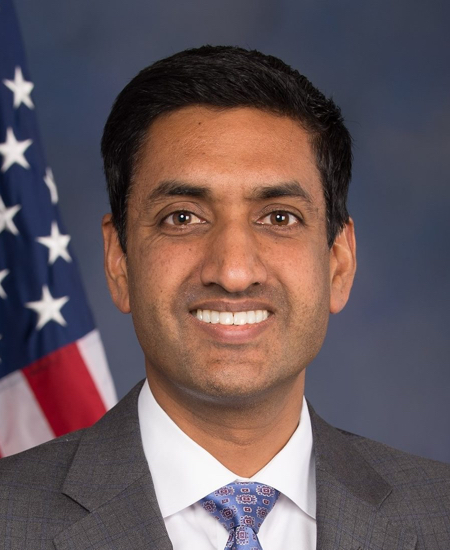
Whale Activity
Position changes in GMED reported for 2026-09-30 by 681 institutional filers
- Increased231
- New83
- Held88
- Decreased185
- Closed62
- No prior filing32
| Filer | Shares | Value | Change |
|---|---|---|---|
| BlackRock, Inc. | 10.9M | $816.9M | increased |
| Janus Henderson Group Ltd. | 8.6M | $646.7M | — |
| VANGUARD CAPITAL MANAGEMENT LLC | 5.1M | $380.2M | decreased |
| VANGUARD PORTFOLIO MANAGEMENT LLC | 4.9M | $364.5M | decreased |
| STATE STREET CORP | 3.7M | $278.5M | increased |
| Boston Partners | 3.4M | $255.9M | increased |
| JPMORGAN CHASE & CO | 3.2M | $239.5M | increased |
| KAYNE ANDERSON RUDNICK INVESTMENT MANAGEMENT LLC | 3.2M | $239.4M | decreased |
| DIMENSIONAL FUND ADVISORS LP | 3.0M | $225.3M | increased |
| Swedbank AB | 2.9M | $215.8M | increased |
| ALLIANCEBERNSTEIN L.P. | 2.8M | $207.8M | increased |
| Invesco Ltd. | 2.6M | $194.8M | decreased |
Every 13F filer's complete reported book, every quarter since 2013-06-30. 13F itself excludes short positions, cash and most options.
Insider Trading
Net shares bought (+) or sold (−) on the open market by GMED insiders, by quarter · Form 4
Recent Insider Transactions
411 transactions on record · newest first
| Insider | Type | Shares | Price | Value | Date | |
|---|---|---|---|---|---|---|
| TOBIN JAMES RDirector · Director | Sale | −4,004 | $75.68 | $303K | Nov 10, 2026 | Form 4 ↗ |
| TOBIN JAMES RDirector · Director | Sale | −37.7K | $75.10 | $2.8M | Nov 10, 2026 | Form 4 ↗ |
| RHOADS ANN DDirector · Director | Sale | −5,000 | $85.00 | $425K | Nov 4, 2026 | Form 4 ↗ |
| TOBIN JAMES RDirector | Sale | −30.0K | $74.58 | $2.2M | Sep 15, 2026 | Form 4 ↗ |
| TOBIN JAMES RDirector | Option exercise | +15.0K | $63.68 | $955K | Sep 15, 2026 | Form 4 ↗ |
| TOBIN JAMES RDirector | Option exercise | +15.0K | $53.75 | $806K | Sep 15, 2026 | Form 4 ↗ |
| ZARRILLI STEPHEN TDirector | Sale | −25.0K | $87.04 | $2.2M | Aug 18, 2026 | Form 4 ↗ |
| ZARRILLI STEPHEN TDirector | Option exercise | +25.0K | $53.27 | $1.3M | Aug 18, 2026 | Form 4 ↗ |
| Davidar David DDirector | Gift | −2,500 | $0.00 | $0 | Jul 27, 2026 | Form 4 ↗ |
| Davidar David DDirector | Sale | −25.0K | $80.76 | $2.0M | Jun 5, 2026 | Form 4 ↗ |
| Davidar David DDirector | Option exercise | +25.0K | $26.27 | $657K | Jun 5, 2026 | Form 4 ↗ |
| RHOADS ANN DDirector | Option exercise | +25.0K | $26.27 | $657K | Jun 4, 2026 | Form 4 ↗ |
| Huller KellyEVP, GC, Corporate Secretary | Sale | −20.0K | $94.50 | $1.9M | Feb 25, 2026 | Form 4 ↗ |
| Huller KellyEVP, GC, Corporate Secretary | Option exercise | +20.0K | $43.58 | $872K | Feb 25, 2026 | Form 4 ↗ |
| Huller KellyEVP, GC, Corporate Secretary | Sale | −10.0K | $87.67 | $877K | Feb 12, 2026 | Form 4 ↗ |
| Huller KellyEVP, GC, Corporate Secretary | Option exercise | +10.0K | $45.64 | $456K | Feb 12, 2026 | Form 4 ↗ |
| Kline KyleSenior Vice President, CFO | Sale | −3,594 | $101.10 | $363K | Jan 8, 2026 | Form 4 ↗ |
| Kline KyleSenior Vice President, CFO | Option exercise | +3,594 | $51.87 | $186K | Jan 8, 2026 | Form 4 ↗ |
| Norwalk Leslie VDirector | Sale | −2,000 | $101.10 | $202K | Jan 8, 2026 | Form 4 ↗ |
| Norwalk Leslie VDirector | Sale | −4,000 | $88.85 | $355K | Dec 12, 2025 | Form 4 ↗ |
Fund Holders
Mutual funds and ETFs holding GMED · SEC Form N-PORT
| Fund | Shares | Value | % of fund | As of |
|---|---|---|---|---|
| iShares Core S&P Mid-Cap ETF iShares Trust | 3.9M | $306.4M | 0.25% | Jun 30, 2026 |
| VANGUARD TOTAL STOCK MARKET INDEX FUND VANGUARD INDEX FUNDS | 3.6M | $284.1M | 0.01% | Jun 30, 2026 |
| VANGUARD SMALL-CAP INDEX FUND VANGUARD INDEX FUNDS | 2.6M | $205.3M | 0.11% | Jun 30, 2026 |
| Janus Henderson Enterprise Fund Janus Investment Fund | 2.2M | $174.4M | 0.78% | Jun 30, 2026 |
| VANGUARD SMALL-CAP GROWTH INDEX FUND VANGUARD INDEX FUNDS | 1.5M | $118.2M | 0.25% | Jun 30, 2026 |
| JPMorgan Mid Cap Value Fund J.P. Morgan Fleming Mutual Fund Group, Inc. | 1.5M | $116.6M | 1.04% | Jun 30, 2026 |
| VANGUARD EXTENDED MARKET INDEX FUND VANGUARD INDEX FUNDS | 1.3M | $102.7M | 0.11% | Jun 30, 2026 |
| Allspring Special Mid Cap Value Fund ALLSPRING FUNDS TRUST | 1.2M | $97.5M | 0.72% | Jun 30, 2026 |
| Janus Henderson Triton Fund Janus Investment Fund | 1.1M | $87.8M | 1.48% | Jun 30, 2026 |
| Disciplined Value Mid Cap Fund John Hancock Funds III | 1.0M | $81.4M | 0.35% | Jun 30, 2026 |
Mutual funds and ETFs whose N-PORT filings list GMED's shares (CUSIP 379577208), each fund at its latest report since Apr 21, 2026, largest positions first. Bonds, options and short positions are left out.
Corporate Lobbying
Estimated quarterly lobbying spending reported under the LDA, filings naming globus medical as client
Government Contracts
Federal awards to globus medical · USAspending
$248KAwarded · 11 contracts on record
- Department of Veterans AffairsPROSTHETICS - SURGICAL IMPLANT$91K
Nov 16, 2026 · ↗ - Department of DefensePRECISION LENGTHENING LEG SYSTEM$64K
Feb 20, 2026 · ↗ - Department of Defense4573064408!REVERE$2K
Jul 28, 2026 · ↗ - Department of Defense4572580890!SPCR SPNL 12X19MM FORTIFY 12MM NS LF$11K
Jul 22, 2026 · ↗ - Department of Defense4570297354!SABLE$13K
Dec 15, 2025 · ↗ - Department of Defense4572495289!SPCR SPNL 30X10X6MM SABLE 8D STRL LF$9K
Jul 21, 2026 · ↗ - Department of Defense4572452841!INSTAFILL$1K
Jul 15, 2026 · ↗ - Department of Defense4572525148!INDEPENDENCE MIS SPACER 26 X 34MM 8, 13M$17K
May 28, 2026 · ↗
U.S. Patents
Recent USPTO applications naming GLOBUS MEDICAL INC
No USPTO patent applications found for GLOBUS MEDICAL INC.
Annual Financials
From GMED's 10-K filings · XBRL
| Fiscal year | FY2025 | FY2024 | FY2023 | FY2022 | FY2021 |
|---|---|---|---|---|---|
| Revenue | $2.94B | $2.52B | $1.57B | $1.02B | $958.1M |
| Operating income | $479.8M | $166.0M | $133.1M | $228.0M | $172.0M |
| Net income | $537.9M | $103.0M | $122.9M | $190.2M | $149.2M |
| Diluted EPS | $3.92 | $0.75 | $1.07 | $1.85 | $1.44 |
| Operating cash flow | $753.4M | $520.6M | $243.5M | $178.5M | $276.3M |
| Cash and equivalents | $526.2M | $784.4M | n/a | n/a | n/a |
| Total assets | $5.30B | $5.25B | $5.09B | $2.08B | $1.96B |
| Total liabilities | $729.5M | $1.07B | $1.09B | $229.8M | $215.9M |
| Shareholders' equity | $4.57B | $4.18B | $4.00B | $1.85B | $1.74B |
As GLOBUS MEDICAL INC tagged them in its 10-K filings: totals for the year on the income and cash-flow lines, values at the year's end on the balance-sheet lines. Latest 10-K, filed Feb 24, 2026 ↗
Stock Splits
Every split and reverse split in the price history
No stock splits in GMED's price history.
Material Events (8-K)
Corporate events filed with the SEC
About GLOBUS MEDICAL INC
From SEC EDGAR company records
Industry (SIC 3841)Surgical & Medical Instruments & Apparatus
SectorHealthcare
HeadquartersAUDUBON, PA
IncorporatedDE
SEC CIK0001237831 ↗