


Caesars Entertainment, Inc.
 United States·USD
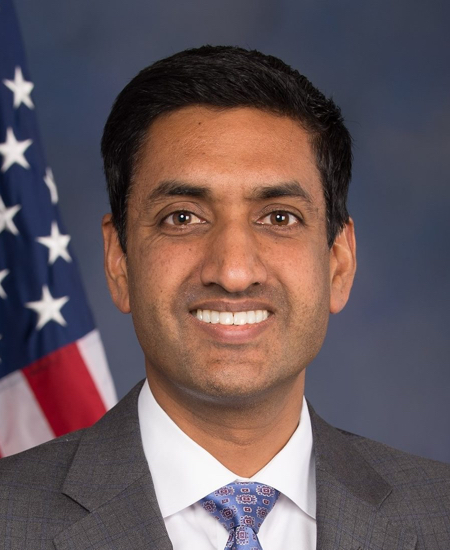
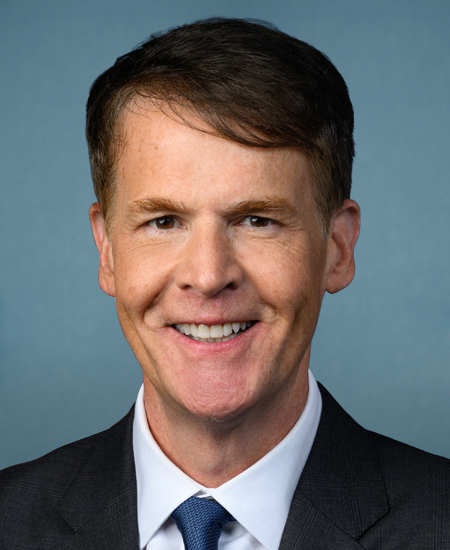
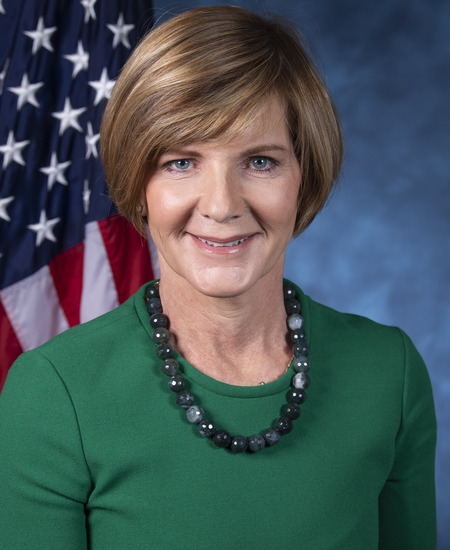
Congressional Trades
Whale Activity
- Increased120
- New31
- Held70
- Decreased130
- Closed70
- No prior filing20
| Filer | Shares | Value | Change |
|---|---|---|---|
| BlackRock, Inc. | 28.5M | $844.0M | increased |
| VANGUARD PORTFOLIO MANAGEMENT LLC | 10.2M | $303.3M | decreased |
| Pentwater Capital Management LP | 9.3M | $277.2M | decreased |
| NOMURA HOLDINGS INC | 9.2M | $272.9M | increased |
| VANGUARD CAPITAL MANAGEMENT LLC | 8.8M | $261.6M | decreased |
| MORGAN STANLEY | 7.9M | $233.9M | decreased |
| STATE STREET CORP | 6.7M | $197.6M | decreased |
| MILLENNIUM MANAGEMENT LLC | 5.7M | $169.6M | increased |
| HBK INVESTMENTS L P | 4.5M | $133.4M | new |
| Westchester Capital Management, LLC | 4.1M | $123.0M | increased |
| Neuberger Berman Group LLC | 3.9M | $116.5M | increased |
| BALYASNY ASSET MANAGEMENT L.P. | 3.9M | $116.1M | decreased |
Every 13F filer's complete reported book, every quarter since 2013-06-30. 13F itself excludes short positions, cash and most options.
Insider Trading
Recent Insider Transactions
| Insider | Type | Shares | Price | Value | Date | |
|---|---|---|---|---|---|---|
| TOMICK DAVID PDirector | Sale | −7,142 | $29.71 | $212K | Sep 15, 2026 | Form 4 ↗ |
| TOMICK DAVID PDirector | Sale | −7,000 | $29.66 | $208K | Sep 14, 2026 | Form 4 ↗ |
| TOMICK DAVID PDirector | Sale | −7,000 | $29.68 | $208K | Sep 11, 2026 | Form 4 ↗ |
| TOMICK DAVID PDirector | Sale | −7,000 | $29.67 | $208K | Sep 10, 2026 | Form 4 ↗ |
| Jones Blackhurst Janis LDirector | Sale | −33.9K | $29.63 | $1.0M | Aug 27, 2026 | Form 4 ↗ |
| Yunker BretChief Financial Officer | Sale | −208.1K | $29.62 | $6.2M | Aug 19, 2026 | Form 4 ↗ |
| Jones JoshChief Marketing Officer | Sale | −59.5K | $29.72 | $1.8M | Aug 14, 2026 | Form 4 ↗ |
| Pegram Michael EDirector | Sale | −16.9K | $29.46 | $498K | Jun 12, 2026 | Form 4 ↗ |
| Pegram Michael EDirector | Sale | −24.8K | $29.47 | $731K | Jun 11, 2026 | Form 4 ↗ |
| Pegram Michael EDirector | Sale | −50.0K | $29.41 | $1.5M | Jun 10, 2026 | Form 4 ↗ |
| Pegram Michael EDirector | Sale | −36.0K | $29.31 | $1.1M | Jun 9, 2026 | Form 4 ↗ |
| Quatmann Edmund L JrChief Legal Officer | Sale | −81.6K | $29.35 | $2.4M | Jun 9, 2026 | Form 4 ↗ |
| Pegram Michael EDirector | Sale | −14.0K | $29.36 | $410K | Jun 8, 2026 | Form 4 ↗ |
| Pegram Michael EDirector | Sale | −15.2K | $29.20 | $444K | Jun 8, 2026 | Form 4 ↗ |
| Pegram Michael EDirector | Sale | −5,000 | $29.19 | $146K | Jun 2, 2026 | Form 4 ↗ |
| Pegram Michael EDirector | Sale | −50.0K | $29.20 | $1.5M | Jun 2, 2026 | Form 4 ↗ |
| Jones JoshChief Marketing Officer | Tax withholding | −925 | $18.95 | $18K | Feb 17, 2026 | Form 4 ↗ |
| Jones JoshChief Marketing Officer | Grant / award | +2,349 | $0.00 | $0 | Feb 17, 2026 | Form 4 ↗ |
| Yunker BretChief Financial Officer | Tax withholding | −3,866 | $18.95 | $73K | Feb 17, 2026 | Form 4 ↗ |
| Yunker BretChief Financial Officer | Grant / award | +9,824 | $0.00 | $0 | Feb 17, 2026 | Form 4 ↗ |
Fund Holders
| Fund | Shares | Value | % of fund | As of |
|---|---|---|---|---|
| iShares Core S&P Small-Cap ETF iShares Trust | 12.3M | $370.3M | 0.33% | Jun 30, 2026 |
| VANGUARD TOTAL STOCK MARKET INDEX FUND VANGUARD INDEX FUNDS | 6.1M | $185.6M | 0.01% | Jun 30, 2026 |
| VANGUARD SMALL-CAP INDEX FUND VANGUARD INDEX FUNDS | 4.4M | $134.0M | 0.07% | Jun 30, 2026 |
| VANGUARD SMALL-CAP VALUE INDEX FUND VANGUARD INDEX FUNDS | 2.8M | $84.8M | 0.13% | Jun 30, 2026 |
| VANGUARD EXTENDED MARKET INDEX FUND VANGUARD INDEX FUNDS | 2.3M | $70.5M | 0.07% | Jun 30, 2026 |
| BlackRock Event Driven Equity Fund BlackRock Large Cap Series Funds, Inc. | 2.0M | $59.2M | 1.23% | Aug 31, 2026 |
| State Street(R) SPDR(R) Portfolio S&P 600(TM) Small Cap ETF SPDR SERIES TRUST | 1.9M | $56.4M | 0.33% | Jun 30, 2026 |
| iShares S&P Small-Cap 600 Value ETF iShares Trust | 1.8M | $52.9M | 0.66% | Jun 30, 2026 |
| Baron Real Estate Fund BARON SELECT FUNDS | 1.6M | $48.8M | 2.13% | Jun 30, 2026 |
| VANGUARD TAX-MANAGED SMALL-CAP FUND VANGUARD TAX-MANAGED FUNDS | 1.4M | $40.8M | 0.36% | Jun 30, 2026 |
Mutual funds and ETFs whose N-PORT filings list CZR's shares (CUSIP 12769G100), each fund at its latest report since Apr 21, 2026, largest positions first. Bonds, options and short positions are left out.
Activist & Passive Stakes
- Matthew HalbowerSCHEDULE 13G/A · passive (13G) · 9.3M shares4.6%
Nov 16, 2026 · ↗ - Pentwater Capital Management LPSCHEDULE 13G/A · passive (13G) · 9.3M shares4.6%
Nov 16, 2026 · ↗ - Matthew HalbowerSCHEDULE 13G · passive (13G) · 11.5M shares5.6%
Aug 14, 2026 · ↗ - Pentwater Capital Management LPSCHEDULE 13G · passive (13G) · 11.5M shares5.6%
Aug 14, 2026 · ↗ - Capital World InvestorsSCHEDULE 13G/A · passive (13G) · 65 shares0.0%
Aug 12, 2026 · ↗ - Cohen & Steers Ireland LimitedSCHEDULE 13G/A · passive (13G) · 9,468 shares0.0%
Jun 5, 2026 · ↗ - Cohen & Steers Asia LimitedSCHEDULE 13G/A · passive (13G) · 0 shares0.0%
Jun 5, 2026 · ↗ - Cohen & Steers UK LimitedSCHEDULE 13G/A · passive (13G) · 21.6K shares0.0%
Jun 5, 2026 · ↗ - Cohen & Steers Capital Management, Inc.SCHEDULE 13G/A · passive (13G) · 4.7M shares2.3%
Jun 5, 2026 · ↗ - Cohen & Steers, Inc.SCHEDULE 13G/A · passive (13G) · 4.7M shares2.3%
Jun 5, 2026 · ↗
Corporate Lobbying
No lobbying filings found naming Caesars Entertainment, Inc. as the client.
Government Contracts
No federal contract awards found for Caesars Entertainment, Inc..
U.S. Patents
No USPTO patent applications found for Caesars Entertainment, Inc..
Annual Financials
| Fiscal year | FY2025 | FY2024 | FY2023 | FY2022 | FY2021 |
|---|---|---|---|---|---|
| Revenue | $11.49B | $11.24B | $11.53B | $10.82B | $9.57B |
| Operating income | $1.86B | $2.30B | $2.47B | $1.74B | $1.46B |
| Net income | -$502.0M | -$278.0M | $786.0M | -$899.0M | -$1.02B |
| Diluted EPS | -$2.42 | -$1.29 | $3.64 | -$4.19 | -$4.83 |
| Operating cash flow | $1.30B | $1.07B | $1.81B | n/a | n/a |
| Cash and equivalents | $887.0M | $866.0M | $1.00B | $1.04B | $1.07B |
| Total assets | $31.64B | $32.59B | $33.37B | $33.53B | $38.03B |
| Total liabilities | $27.95B | $28.21B | $28.65B | $29.78B | $33.49B |
| Shareholders' equity | $3.50B | $4.16B | $4.55B | $3.71B | $4.48B |
As Caesars Entertainment, Inc. tagged them in its 10-K filings: totals for the year on the income and cash-flow lines, values at the year's end on the balance-sheet lines. Latest 10-K, filed Feb 17, 2026 ↗
Stock Splits
No stock splits in CZR's price history.
Material Events (8-K)
- 8-K · Items 2.02, 9.01Results of operationsOct 27, 2026
EDGAR ↗ - 8-K · Items 5.07Shareholder voteSep 23, 2026
EDGAR ↗ - 8-K · Items 8.01Other eventsSep 22, 2026
EDGAR ↗ - 8-K · Items 5.02, 8.01Officer / director change · Other eventsSep 17, 2026
EDGAR ↗ - 8-K · Items 2.02, 9.01Results of operationsJul 28, 2026
EDGAR ↗ - 8-K · Items 5.02Officer / director changeJul 8, 2026
EDGAR ↗ - 8-K · Items 5.07Shareholder voteJun 12, 2026
EDGAR ↗ - 8-K · Items 1.01, 7.01, 9.01Material agreement · Reg FD disclosureMay 28, 2026
EDGAR ↗