


CHEVRON CORP
 United States·USD
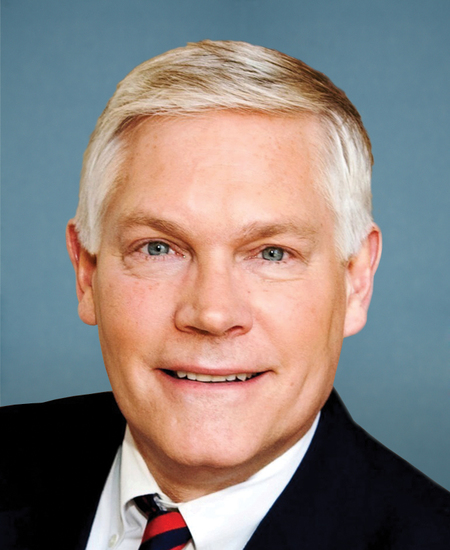
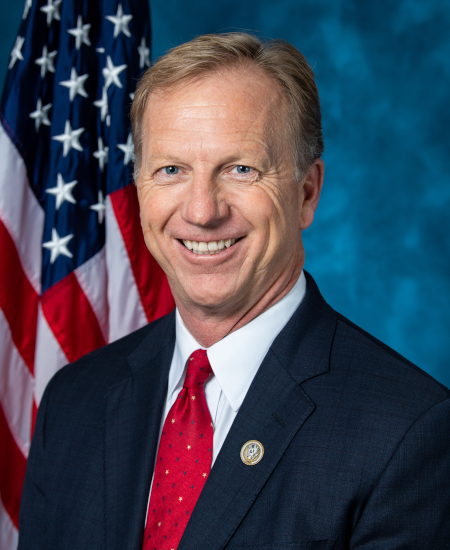
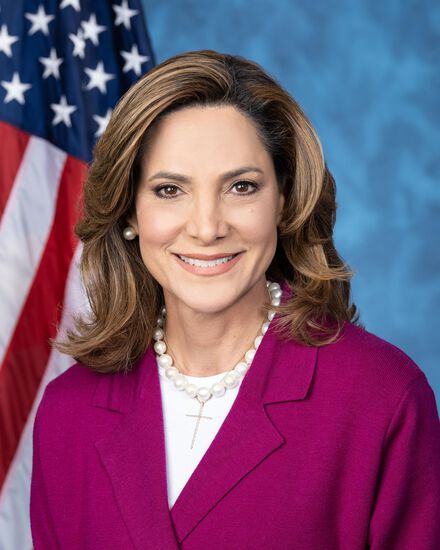
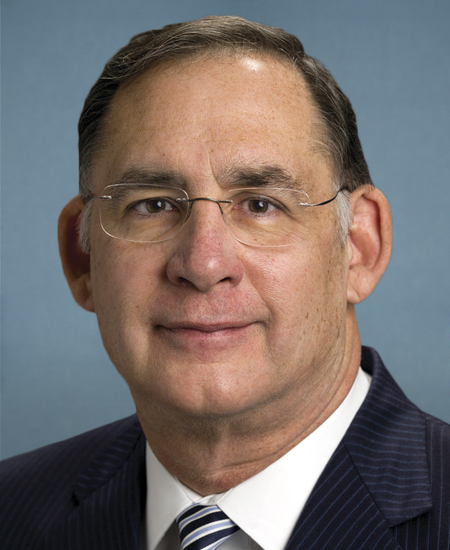
Congressional Trades


Whale Activity
- Increased1809
- New281
- Held400
- Decreased1611
- Closed117
- No prior filing182
| Filer | Shares | Value | Change |
|---|---|---|---|
| BlackRock, Inc. | 160.0M | $32.67B | increased |
| STATE STREET CORP | 154.4M | $31.54B | increased |
| VANGUARD CAPITAL MANAGEMENT LLC | 126.0M | $25.72B | increased |
| BERKSHIRE HATHAWAY INC | 84.4M | $17.23B | held |
| GEODE CAPITAL MANAGEMENT, LLC | 46.8M | $9.52B | increased |
| VANGUARD PORTFOLIO MANAGEMENT LLC | 43.3M | $8.84B | increased |
| CHARLES SCHWAB INVESTMENT MANAGEMENT INC | 39.6M | $8.09B | increased |
| MORGAN STANLEY | 36.6M | $7.47B | increased |
| BANK OF AMERICA CORP /DE/ | 28.8M | $5.88B | increased |
| NORTHERN TRUST CORP | 20.3M | $4.14B | increased |
| AMERIPRISE FINANCIAL INC | 19.6M | $4.00B | — |
| JPMORGAN CHASE & CO | 18.2M | $3.71B | decreased |
Every 13F filer's complete reported book, every quarter since 2013-06-30. 13F itself excludes short positions, cash and most options.
Insider Trading
Recent Insider Transactions
| Insider | Type | Shares | Price | Value | Date | |
|---|---|---|---|---|---|---|
| Booth Thomas RyderChief Technology & Eng Ofr | Sale | −6,000 | $212.14 | $1.3M | Nov 11, 2026 | Form 4 ↗ |
| NELSON MARK AVice Chairman | Sale | −81.9K | $210.47 | $17.2M | Nov 10, 2026 | Form 4 ↗ |
| NELSON MARK AVice Chairman | Sale | −30.1K | $210.48 | $6.3M | Nov 10, 2026 | Form 4 ↗ |
| GUSTAVSON JEFF BPresident, New Energies | Sale | −24.4K | $230.71 | $5.6M | Nov 2, 2026 | Form 4 ↗ |
| Pate R. HewittChief Legal Officer | Sale | −40.7K | $226.65 | $9.2M | Oct 20, 2026 | Form 4 ↗ |
| Pate R. HewittChief Legal Officer | Sale | −2,400 | $225.61 | $541K | Oct 19, 2026 | Form 4 ↗ |
| Pate R. HewittChief Legal Officer | Sale | −2,470 | $205.11 | $507K | Aug 18, 2026 | Form 4 ↗ |
| Moyo Dambisa FDirector | Gift | −350 | $0.00 | $0 | Aug 17, 2026 | Form 4 ↗ |
| Walz Andrew BenjaminPresident, DM&C | Sale | −16.8K | $201.06 | $3.4M | Aug 17, 2026 | Form 4 ↗ |
| Walz Andrew BenjaminPresident, DM&C | Option exercise | +12.7K | $132.69 | $1.7M | Aug 17, 2026 | Form 4 ↗ |
| Walz Andrew BenjaminPresident, DM&C | Option exercise | +4,100 | $88.20 | $362K | Aug 17, 2026 | Form 4 ↗ |
| Wirth Michael KChairman and CEO · Director | Sale | −10.3K | $201.05 | $2.1M | Aug 14, 2026 | Form 4 ↗ |
| Wirth Michael KChairman and CEO · Director | Sale | −306.8K | $200.44 | $61.5M | Aug 14, 2026 | Form 4 ↗ |
| Wirth Michael KChairman and CEO · Director | Option exercise | +317.1K | $88.20 | $28.0M | Aug 14, 2026 | Form 4 ↗ |
| GUSTAVSON JEFF BPresident, New Energies | Sale | −14.0K | $194.95 | $2.7M | Aug 11, 2026 | Form 4 ↗ |
| GUSTAVSON JEFF BPresident, New Energies | Option exercise | +4,561 | $113.01 | $515K | Aug 11, 2026 | Form 4 ↗ |
| GUSTAVSON JEFF BPresident, New Energies | Option exercise | +4,633 | $125.35 | $581K | Aug 11, 2026 | Form 4 ↗ |
| GUSTAVSON JEFF BPresident, New Energies | Option exercise | +4,850 | $117.24 | $569K | Aug 11, 2026 | Form 4 ↗ |
| Wirth Michael KChairman and CEO · Director | Sale | −5,547 | $187.00 | $1.0M | Aug 5, 2026 | Form 4 ↗ |
| HESS JOHN BDirector | Sale | −30.0K | $195.14 | $5.9M | Aug 3, 2026 | Form 4 ↗ |
Fund Holders
| Fund | Shares | Value | % of fund | As of |
|---|---|---|---|---|
| VANGUARD TOTAL STOCK MARKET INDEX FUND VANGUARD INDEX FUNDS | 60.1M | $9.96B | 0.43% | Jun 30, 2026 |
| VANGUARD 500 INDEX FUND VANGUARD INDEX FUNDS | 48.5M | $8.04B | 0.48% | Jun 30, 2026 |
| State Street(R) Energy Select Sector SPDR(R) ETF SELECT SECTOR SPDR TRUST | 34.7M | $5.75B | 16.09% | Jun 30, 2026 |
| Fidelity 500 Index Fund Fidelity Concord Street Trust | 24.3M | $5.01B | 0.58% | Aug 31, 2026 |
| Schwab U.S. Dividend Equity ETF SCHWAB STRATEGIC TRUST | 21.9M | $4.51B | 4.01% | Aug 31, 2026 |
| iShares Core S&P 500 ETF iShares Trust | 25.8M | $4.27B | 0.48% | Jun 30, 2026 |
| State Street(R) SPDR(R) S&P 500(R) ETF Trust | 22.7M | $3.76B | 0.48% | Jun 30, 2026 |
| VANGUARD VALUE INDEX FUND VANGUARD INDEX FUNDS | 18.0M | $2.98B | 1.17% | Jun 30, 2026 |
| VANGUARD ENERGY INDEX FUND VANGUARD WORLD FUND | 9.1M | $1.87B | 14.11% | Aug 31, 2026 |
| VANGUARD INSTITUTIONAL INDEX FUND VANGUARD INSTITUTIONAL INDEX FUNDS | 10.2M | $1.68B | 0.48% | Jun 30, 2026 |
Mutual funds and ETFs whose N-PORT filings list CVX's shares (CUSIP 166764100), each fund at its latest report since Apr 22, 2026, largest positions first. Bonds, options and short positions are left out.
Activist & Passive Stakes
- Columbia Insurance CompanySCHEDULE 13G/A · passive (13G) · 9.2M shares0.5%
May 15, 2026 · ↗ - Government Employees Insurance CompanySCHEDULE 13G/A · passive (13G) · 13.5M shares0.7%
May 15, 2026 · ↗ - GEICO CorporationSCHEDULE 13G/A · passive (13G) · 13.5M shares0.7%
May 15, 2026 · ↗ - National Indemnity CompanySCHEDULE 13G/A · passive (13G) · 75.2M shares3.8%
May 15, 2026 · ↗ - Berkshire Hathaway Inc.SCHEDULE 13G/A · passive (13G) · 84.4M shares4.2%
May 15, 2026 · ↗ - Warren E. BuffettSCHEDULE 13G/A · passive (13G) · 84.4M shares4.2%
May 15, 2026 · ↗ - Vanguard Capital ManagementSCHEDULE 13G · passive (13G) · 141.2M shares7.1%
Apr 29, 2026 · ↗ - The Vanguard GroupSCHEDULE 13G/A · passive (13G) · 0 shares0.0%
Mar 26, 2026 · ↗ - STATE STREET CORPORATIONSCHEDULE 13G · passive (13G) · 152.6M shares7.5%
Nov 10, 2025 · ↗
Corporate Lobbying
No lobbying filings found naming CHEVRON CORP as the client.
Government Contracts
No federal contract awards found for CHEVRON CORP.
U.S. Patents
No USPTO patent applications found for CHEVRON CORP.
Annual Financials
| Fiscal year | FY2025 | FY2024 | FY2023 | FY2022 | FY2021 |
|---|---|---|---|---|---|
| Revenue | $189.03B | $202.79B | $200.95B | $246.25B | $162.47B |
| Net income | $12.30B | $17.66B | $21.37B | $35.47B | $15.63B |
| Diluted EPS | $6.63 | $9.72 | $11.36 | $18.28 | $8.14 |
| Operating cash flow | $33.94B | $31.49B | $35.61B | $49.60B | $29.19B |
| Cash and equivalents | n/a | n/a | $8.18B | $17.68B | $5.64B |
| Total assets | $324.01B | $256.94B | $261.63B | $257.71B | $239.53B |
| Total liabilities | $131.84B | $103.78B | $99.70B | $97.47B | $99.59B |
| Shareholders' equity | $186.45B | $152.32B | $160.96B | $159.28B | $139.07B |
As CHEVRON CORP tagged them in its 10-K filings: totals for the year on the income and cash-flow lines, values at the year's end on the balance-sheet lines. Latest 10-K, filed Feb 24, 2026 ↗
Stock Splits
- 2-for-1Stock splitSep 13, 2004
- 2-for-1Stock splitJun 13, 1994
Split dates and ratios from the price history · Close Prices from Tiingo.com
Material Events (8-K)
- 8-K · Items 2.02, 9.01Results of operationsOct 30, 2026
EDGAR ↗ - 8-K · Items 7.01, 8.01, 9.01Reg FD disclosure · Other eventsOct 6, 2026
EDGAR ↗ - 8-K · Items 5.02Officer / director changeOct 5, 2026
EDGAR ↗ - 8-K · Items 2.02, 9.01Results of operationsJul 31, 2026
EDGAR ↗ - 8-K · Items 5.07Shareholder voteMay 29, 2026
EDGAR ↗ - 8-K · Items 5.02Officer / director changeMay 29, 2026
EDGAR ↗ - 8-K · Items 2.02, 9.01Results of operationsMay 1, 2026
EDGAR ↗ - 8-K · Items 2.02Results of operationsApr 9, 2026
EDGAR ↗ - 8-K · Items 5.03, 9.01Bylaw amendmentMar 25, 2026
EDGAR ↗ - 8-K · Items 5.02Officer / director changeJan 30, 2026
EDGAR ↗