

Stocks › CIEN

CIENA CORP
CIEN·NYSE· United States·USD
$234.37
-28.26 (-10.76%)
Close · Nov 20, 2026 · Close Prices from Tiingo.com
CIEN
CIENA CORP · NYSE
Nasdaq 100S&P 500
Filings
Default90D1Y5YALL
CIENS&P 500 (rebased)
Congress BuyCongress SellInsider BuyInsider SellForm 1448-K ResultsLobbying
Loading price history…
Daily closes, adjusted for splits and dividends · Close Prices from Tiingo.comHover a marker, every one is a filing · move across the line for the crosshair
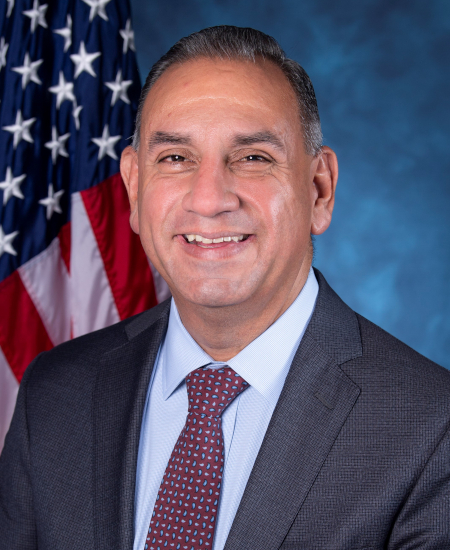
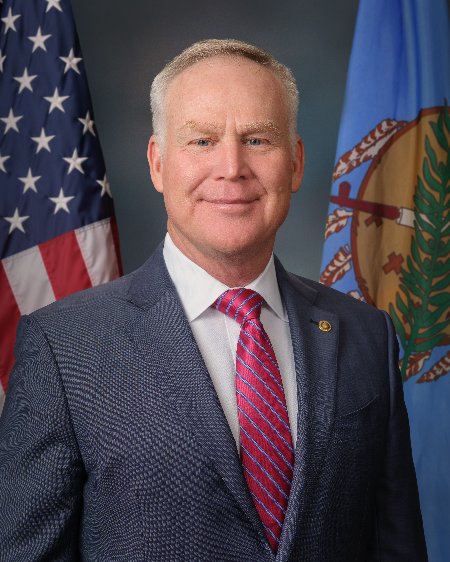
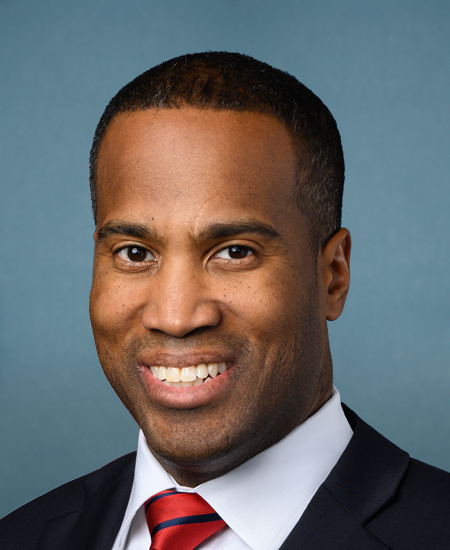
Congressional Trades
Recent trades of CIEN by members of U.S. Congress · 34 on record · 15 in the last 12 months




Whale Activity
Position changes in CIEN reported for 2026-09-30 by 1339 institutional filers
- Increased417
- New129
- Held129
- Decreased405
- Closed205
- No prior filing54
| Filer | Shares | Value | Change |
|---|---|---|---|
| FMR LLC | 17.8M | $6.25B | decreased |
| BlackRock, Inc. | 13.0M | $4.58B | increased |
| VANGUARD CAPITAL MANAGEMENT LLC | 9.3M | $3.26B | increased |
| VANGUARD PORTFOLIO MANAGEMENT LLC | 7.8M | $2.74B | increased |
| STATE STREET CORP | 6.6M | $2.33B | decreased |
| PRICE T ROWE ASSOCIATES INC /MD/ | 5.8M | $2.05B | increased |
| JPMORGAN CHASE & CO | 3.8M | $1.33B | decreased |
| GEODE CAPITAL MANAGEMENT, LLC | 3.4M | $1.18B | increased |
| Invesco Ltd. | 2.0M | $717.5M | increased |
| AMERICAN CENTURY COMPANIES INC | 1.9M | $662.9M | increased |
| Capital Research Global Investors | 1.7M | $603.5M | increased |
| MORGAN STANLEY | 1.6M | $562.7M | decreased |
Every 13F filer's complete reported book, every quarter since 2013-06-30. 13F itself excludes short positions, cash and most options.
Insider Trading
Net shares bought (+) or sold (−) on the open market by CIEN insiders, by quarter · Form 4
Recent Insider Transactions
5,588 transactions on record · newest first
| Insider | Type | Shares | Price | Value | Date | |
|---|---|---|---|---|---|---|
| Graff Marc D.EVP & Chief Financial Officer | Sale | −1,240 | $265.00 | $329K | Nov 16, 2026 | Form 4 ↗ |
| Rothenstein David MEVP & Chief Strategy Officer | Sale | −2,500 | $260.89 | $652K | Nov 16, 2026 | Form 4 ↗ |
| SMITH GARY BPresident & CEO · Director | Sale | −2,952 | $260.84 | $770K | Nov 16, 2026 | Form 4 ↗ |
| SMITH GARY BPresident & CEO · Director | Sale | −2,952 | $298.16 | $880K | Nov 2, 2026 | Form 4 ↗ |
| Gage BrodieEVP & Chief Product & Tech | Sale | −1,200 | $344.08 | $413K | Oct 15, 2026 | Form 4 ↗ |
| DiPerna DinoEVP & Chief R&D Officer | Sale | −445 | $350.00 | $156K | Oct 15, 2026 | Form 4 ↗ |
| DiPerna DinoEVP & Chief R&D Officer | Sale | −445 | $344.08 | $153K | Oct 15, 2026 | Form 4 ↗ |
| Rothenstein David MEVP & Chief Strategy Officer | Sale | −2,500 | $348.06 | $870K | Oct 15, 2026 | Form 4 ↗ |
| SMITH GARY BPresident & CEO · Director | Sale | −2,952 | $348.02 | $1.0M | Oct 15, 2026 | Form 4 ↗ |
| SMITH GARY BPresident & CEO · Director | Sale | −2,952 | $369.66 | $1.1M | Oct 1, 2026 | Form 4 ↗ |
| Graff Marc D.EVP & Chief Financial Officer | Sale | −97 | $355.19 | $34K | Oct 1, 2026 | Form 4 ↗ |
| Kosaraju SheelaEVP & Chief Legal Officer | Sale | −2,101 | $355.19 | $746K | Oct 1, 2026 | Form 4 ↗ |
| Phipps JasonEVP & Chief Customer Officer | Sale | −2,629 | $355.19 | $934K | Oct 1, 2026 | Form 4 ↗ |
| Cumello JosephEVP & General Mgr. | Sale | −1,586 | $358.52 | $569K | Sep 25, 2026 | Form 4 ↗ |
| Claflin Bruce L.Director | Sale | −2,857 | $355.91 | $1.0M | Sep 24, 2026 | Form 4 ↗ |
| NEVENS THOMAS MICHAELDirector | Gift | −2,797 | — | — | Sep 24, 2026 | Form 4 ↗ |
| NEVENS THOMAS MICHAELDirector | Sale | −3,738 | $359.04 | $1.3M | Sep 23, 2026 | Form 4 ↗ |
| Hoffman GrantEVP & Chief Supply | Tax withholding | −170 | $348.80 | $59K | Sep 20, 2026 | Form 4 ↗ |
| Graff Marc D.EVP & Chief Financial Officer | Tax withholding | −286 | $348.80 | $100K | Sep 20, 2026 | Form 4 ↗ |
| Gage BrodieEVP & Chief Product & | Tax withholding | −231 | $348.80 | $81K | Sep 20, 2026 | Form 4 ↗ |
Fund Holders
Mutual funds and ETFs holding CIEN · SEC Form N-PORT
| Fund | Shares | Value | % of fund | As of |
|---|---|---|---|---|
| VANGUARD TOTAL STOCK MARKET INDEX FUND VANGUARD INDEX FUNDS | 4.5M | $2.20B | 0.10% | Jun 30, 2026 |
| JPMorgan Large Cap Growth Fund JPMorgan Trust II | 4.3M | $2.11B | 1.73% | Jun 30, 2026 |
| Fidelity Growth Company Fund Fidelity Mt. Vernon Street Trust | 5.3M | $2.02B | 2.07% | Aug 31, 2026 |
| VANGUARD 500 INDEX FUND VANGUARD INDEX FUNDS | 3.7M | $1.80B | 0.11% | Jun 30, 2026 |
| VANGUARD MID-CAP INDEX FUND VANGUARD INDEX FUNDS | 3.1M | $1.50B | 0.67% | Jun 30, 2026 |
| iShares Core S&P 500 ETF iShares Trust | 1.9M | $953.9M | 0.11% | Jun 30, 2026 |
| State Street(R) SPDR(R) S&P 500(R) ETF Trust | 1.7M | $838.7M | 0.11% | Jun 30, 2026 |
| VANGUARD GROWTH INDEX FUND VANGUARD INDEX FUNDS | 1.6M | $796.1M | 0.21% | Jun 30, 2026 |
| Fidelity 500 Index Fund Fidelity Concord Street Trust | 1.8M | $702.6M | 0.08% | Aug 31, 2026 |
| Fidelity Growth Company K6 Fund Fidelity Mt. Vernon Street Trust | 1.5M | $582.0M | 2.07% | Aug 31, 2026 |
Mutual funds and ETFs whose N-PORT filings list CIEN's shares (CUSIP 171779309), each fund at its latest report since Apr 21, 2026, largest positions first. Bonds, options and short positions are left out.
Activist & Passive Stakes
Schedule 13D / 13G beneficial-ownership filings
- JPMORGAN CHASE & CO.SCHEDULE 13G/A · passive (13G) · 5.6M shares3.9%
Sep 3, 2026 · ↗ - Abigail P. JohnsonSCHEDULE 13G/A · passive (13G) · 19.1M shares13.5%
Aug 6, 2026 · ↗ - FMR LLCSCHEDULE 13G/A · passive (13G) · 19.1M shares13.5%
Aug 6, 2026 · ↗ - JPMORGAN CHASE & CO.SCHEDULE 13G · passive (13G) · 10.9M shares7.7%
Jan 21, 2026 · ↗
Corporate Lobbying
Estimated quarterly lobbying spending reported under the LDA, filings naming ciena as client
- AKIN GUMP STRAUSS HAUER & FELDCIENA CORPORATION · 2026 Q3 · TRD$80K
Filing ↗ - VALCOUR LLCCIENA GROUP · 2026 Q3 · FOR$80K
Filing ↗ - CIENA CORPORATION (FORMERLY CIENA CORPORATION, BROADBAND GROUP)CIENA CORPORATION (FORMERLY CIENA CORPORATION, BROADBAND GROUP) · 2026 Q3 · TRD, HOM, FOR, TEC$260K
Filing ↗ - VALCOUR LLCCIENA GROUP · 2026 Q3 · FOR—
Filing ↗ - AKIN GUMP STRAUSS HAUER & FELDCIENA CORPORATION · 2026 Q2 · TRD$80K
Filing ↗
Government Contracts
Federal awards to CIENA CORP · USAspending
No federal contract awards found for CIENA CORP.
U.S. Patents
Recent USPTO applications naming CIENA CORP
No USPTO patent applications found for CIENA CORP.
Annual Financials
From CIEN's 10-K filings · XBRL
| Fiscal year | FY2025 | FY2024 | FY2023 | FY2022 | FY2021 |
|---|---|---|---|---|---|
| Revenue | $4.77B | $4.01B | $4.39B | $3.63B | $3.62B |
| Operating income | $197.5M | $166.6M | $357.5M | $222.8M | $495.4M |
| Net income | $123.3M | $84.0M | $254.8M | $152.9M | $500.2M |
| Diluted EPS | $0.85 | $0.58 | $1.71 | $1.00 | $3.19 |
| Operating cash flow | $806.1M | $514.5M | $168.3M | -$167.8M | $541.6M |
| Cash and equivalents | $1.09B | $934.9M | $1.01B | $994.4M | $1.42B |
| Total assets | $5.86B | $5.64B | $5.60B | $5.07B | $4.87B |
| Total liabilities | $3.14B | $2.83B | $2.75B | $2.36B | $1.85B |
| Shareholders' equity | $2.73B | $2.82B | $2.85B | $2.71B | $3.02B |
As CIENA CORP tagged them in its 10-K filings: totals for the year on the income and cash-flow lines, values at the year's end on the balance-sheet lines. Latest 10-K, filed Dec 12, 2025 ↗
Stock Splits
Every split and reverse split in the price history
- 1-for-7Reverse splitSep 25, 2006
- 2-for-1Stock splitSep 19, 2000
Split dates and ratios from the price history · Close Prices from Tiingo.com
Material Events (8-K)
Corporate events filed with the SEC
- 8-K · Items 8.01Other eventsNov 16, 2026
EDGAR ↗ - 8-K · Items 2.02, 9.01Results of operationsSep 3, 2026
EDGAR ↗ - 8-K · Items 1.01, 2.03, 3.02, 8.01, 9.01Material agreement · Direct financial obligation · Unregistered sale of equityJun 11, 2026
EDGAR ↗ - 8-K · Items 8.01, 9.01Other eventsJun 8, 2026
EDGAR ↗ - 8-K · Items 2.02, 9.01Results of operationsJun 4, 2026
EDGAR ↗
About CIENA CORP
From SEC EDGAR company records
Industry (SIC 3661)Telephone & Telegraph Apparatus
SectorTechnology
HeadquartersHANOVER, MD
IncorporatedMD
SEC CIK0000936395 ↗